
The MLOps Hiring Market in 2026: Demand and Top Employers
Where mlops jobs are in 2026: hiring demand and trend, top states and cities, who's hiring by sector and company size, and the mix of seniority, contract type and remote work across US postings.
Updated: July 13, 2026

The MLOps job market in 2026
Drawing on 1,959 US job postings analyzed this quarter, this is where MLOps hiring stands: the median salary is $184,000, the market runs steady at 70 postings a week, and California alone posts 27% of all roles. Unlike AI strategy or product leadership, which skew toward directors and VPs, MLOps hiring is overwhelmingly individual contributor work — 83% of postings sit at IC level, most of them mid or senior.
- MLOps hiring holds steady: ~70 US postings per week through mid-2026, with no sign of contraction — the floor isn't falling out, but demand isn't spiking either.
- This is an IC market for MLOps: 36% of postings target mid-level ICs, 33% senior ICs and 13% Principal ICs; management roles account for only 8% of all MLOps demand.
- Enterprise employers lead but startups show up in MLOps: 34% of postings come from 10,000+ employee firms, yet companies under 50 employees post 13% of MLOps roles.
- Remote flexibility runs higher in MLOps than most AI functions: 42% of specified roles are fully remote, 38% hybrid and only 19% require in-person presence.
- California dominates MLOps geography: 27% of all US postings come from CA; San Francisco alone accounts for 9% of national MLOps hiring.
- Contract work is more common in MLOps: 13% of postings are contract roles — double the share in many AI functions — reflecting project-based deployments and temporary infrastructure buildouts.
How MLOps hiring demand is trending
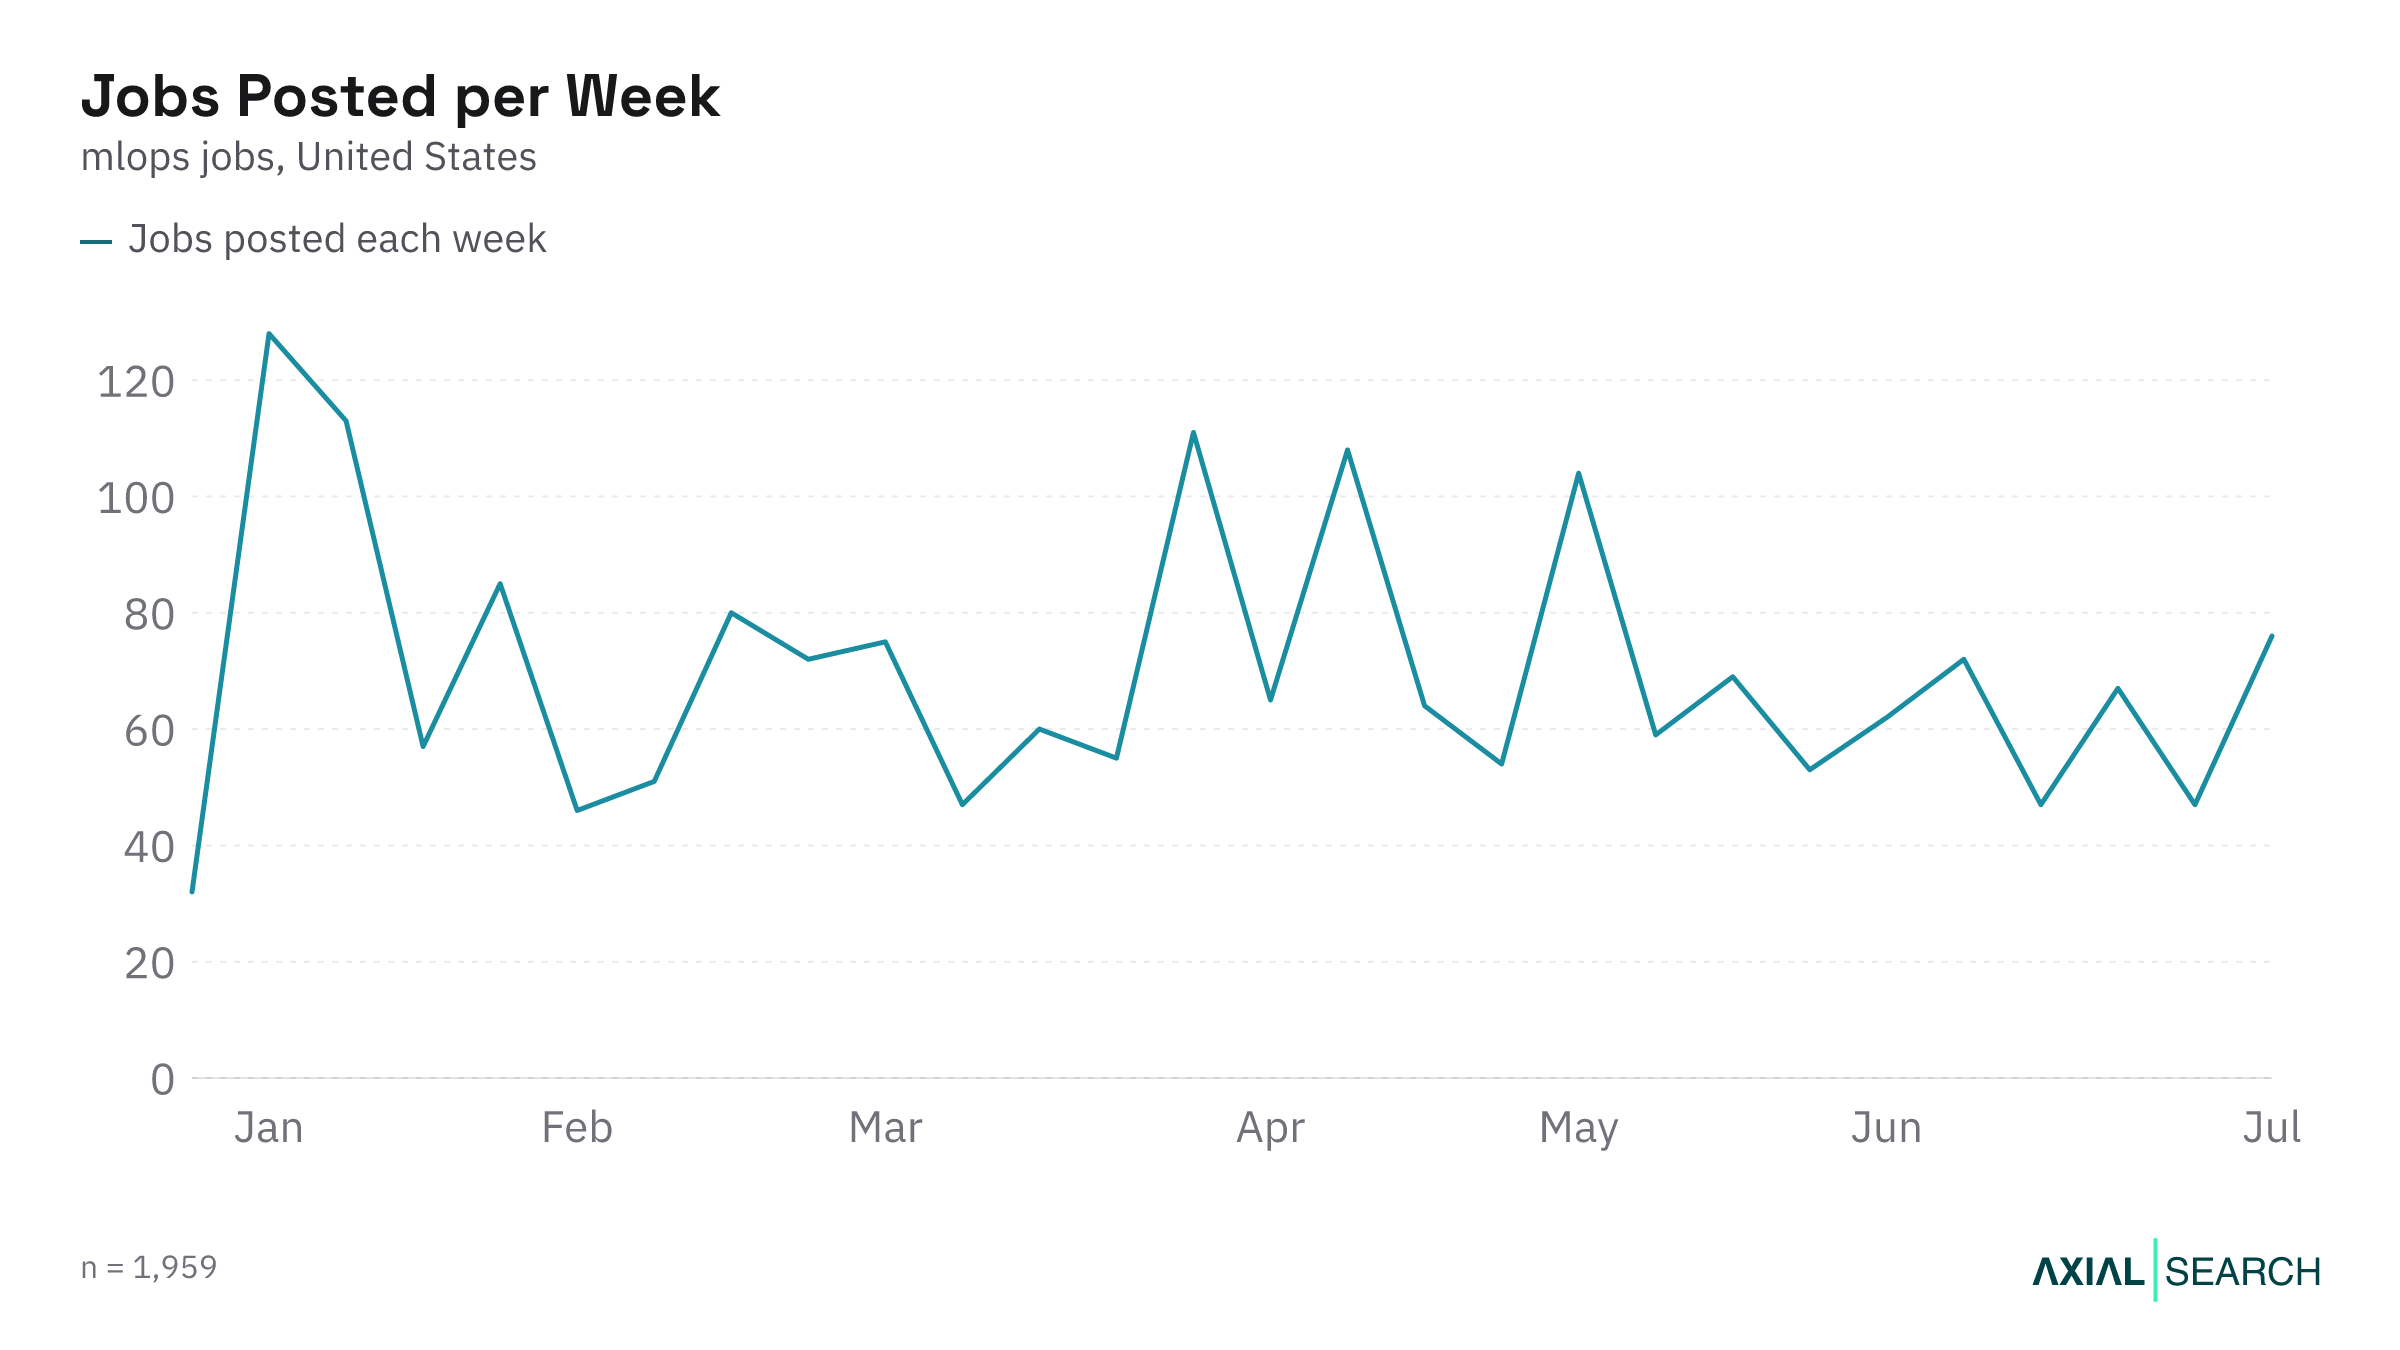
MLOps hiring has held steady through the first half of 2026, averaging around 70 new US postings a week. The weekly count ranged from a low of 32 in late January to a high of 128 the first week of the year, but the baseline sits between 50 and 80 most weeks. Brief spikes hit 113 postings in mid-January, 111 in late March and 108 in mid-April, yet the trend through July hasn't dropped below 47.
The pattern is consistency, not acceleration.
For candidates, that means the floor isn't falling out. For employers, it means you're competing with a steady stream of other companies for the same pool of people who can ship models to production and keep them running at scale.
Who's hiring MLOps talent
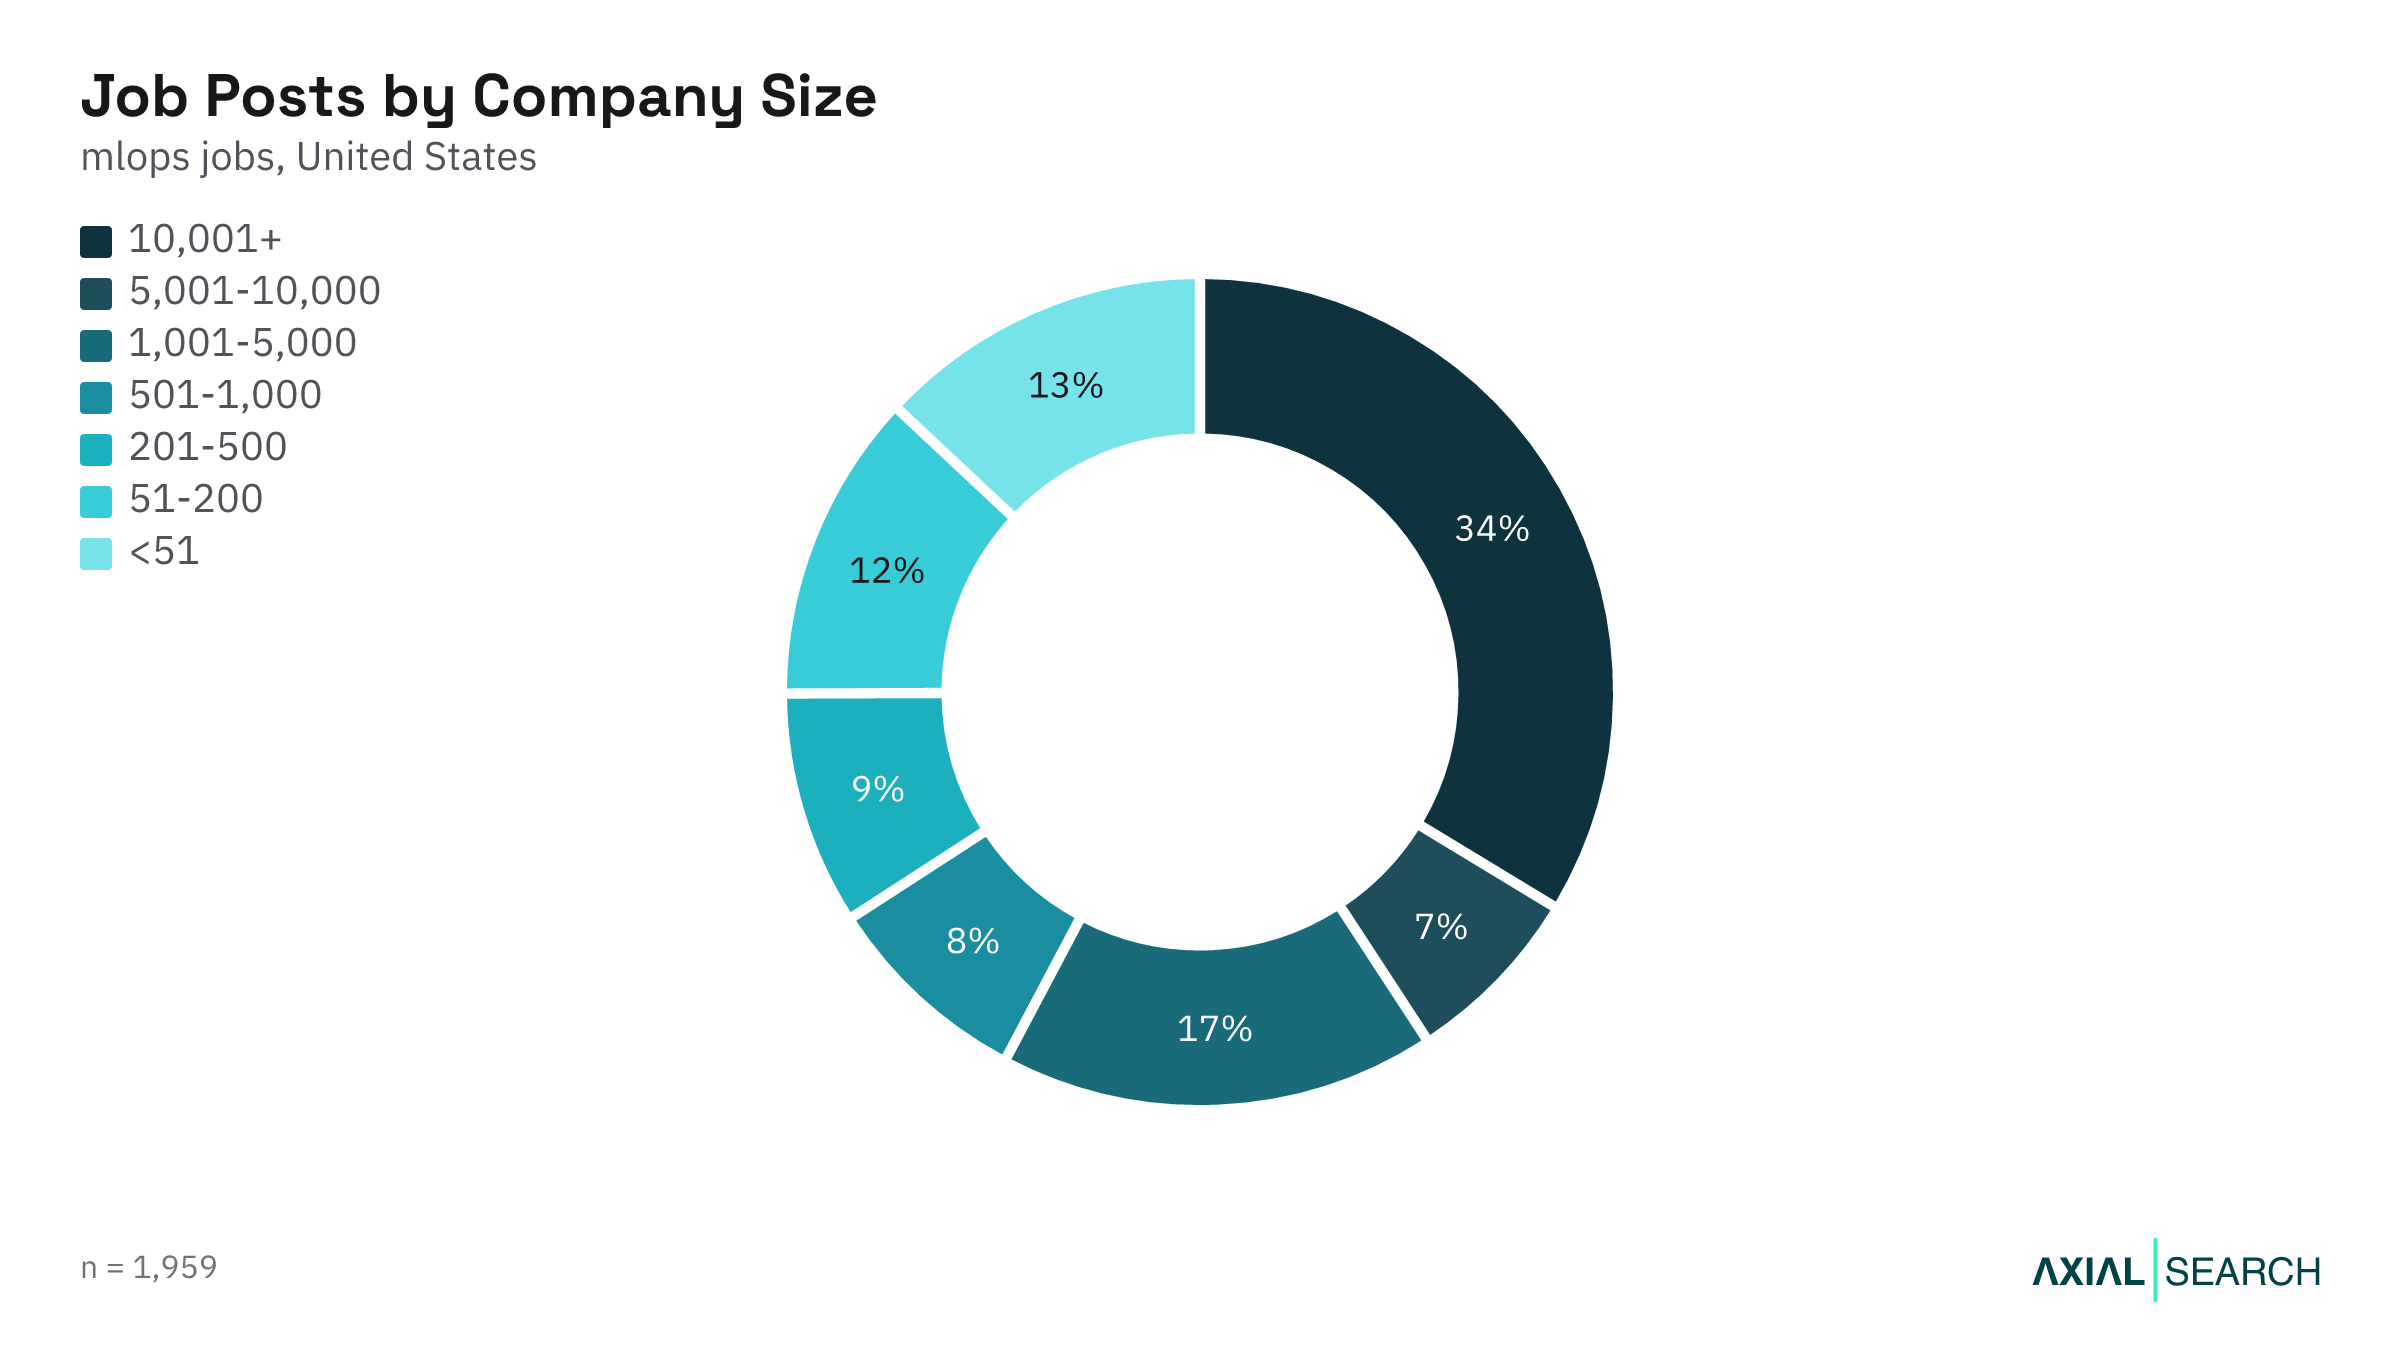
Companies with 10,001+ employees post 34% of MLOps roles, but the distribution is broader than in senior AI leadership hiring. Mid-sized firms with 1,001–5,000 employees account for 17%, and startups under 51 employees post 13% — a meaningful slice that reflects early-stage teams building their first production pipelines. Companies with 51–200 employees post 12%, and the 201–500 band adds another 9%.
MLOps spans the company-size spectrum because both large-scale model operations and early-stage product teams need someone to own the deployment pipeline.
That breadth shows up in the sector mix. Technology leads at 33%, but IT Services posts 18%, Manufacturing 9%, Financial Services 7% and Retail 5%.
| Sector | Share of MLOps postings |
|---|---|
| Technology | 33% |
| IT Services | 18% |
| Manufacturing | 9% |
| Financial Services | 7% |
| Professional Services | 6% |
| Retail and Hospitality | 5% |
| Healthcare | 3% |
This is not a tech-only function — any organization running models in production eventually needs MLOps, whether they're manufacturing widgets or processing payments.
What kind of MLOps roles are being posted
These are IC-heavy, mostly full-time and increasingly location-flexible roles.
Seniority levels in MLOps hiring
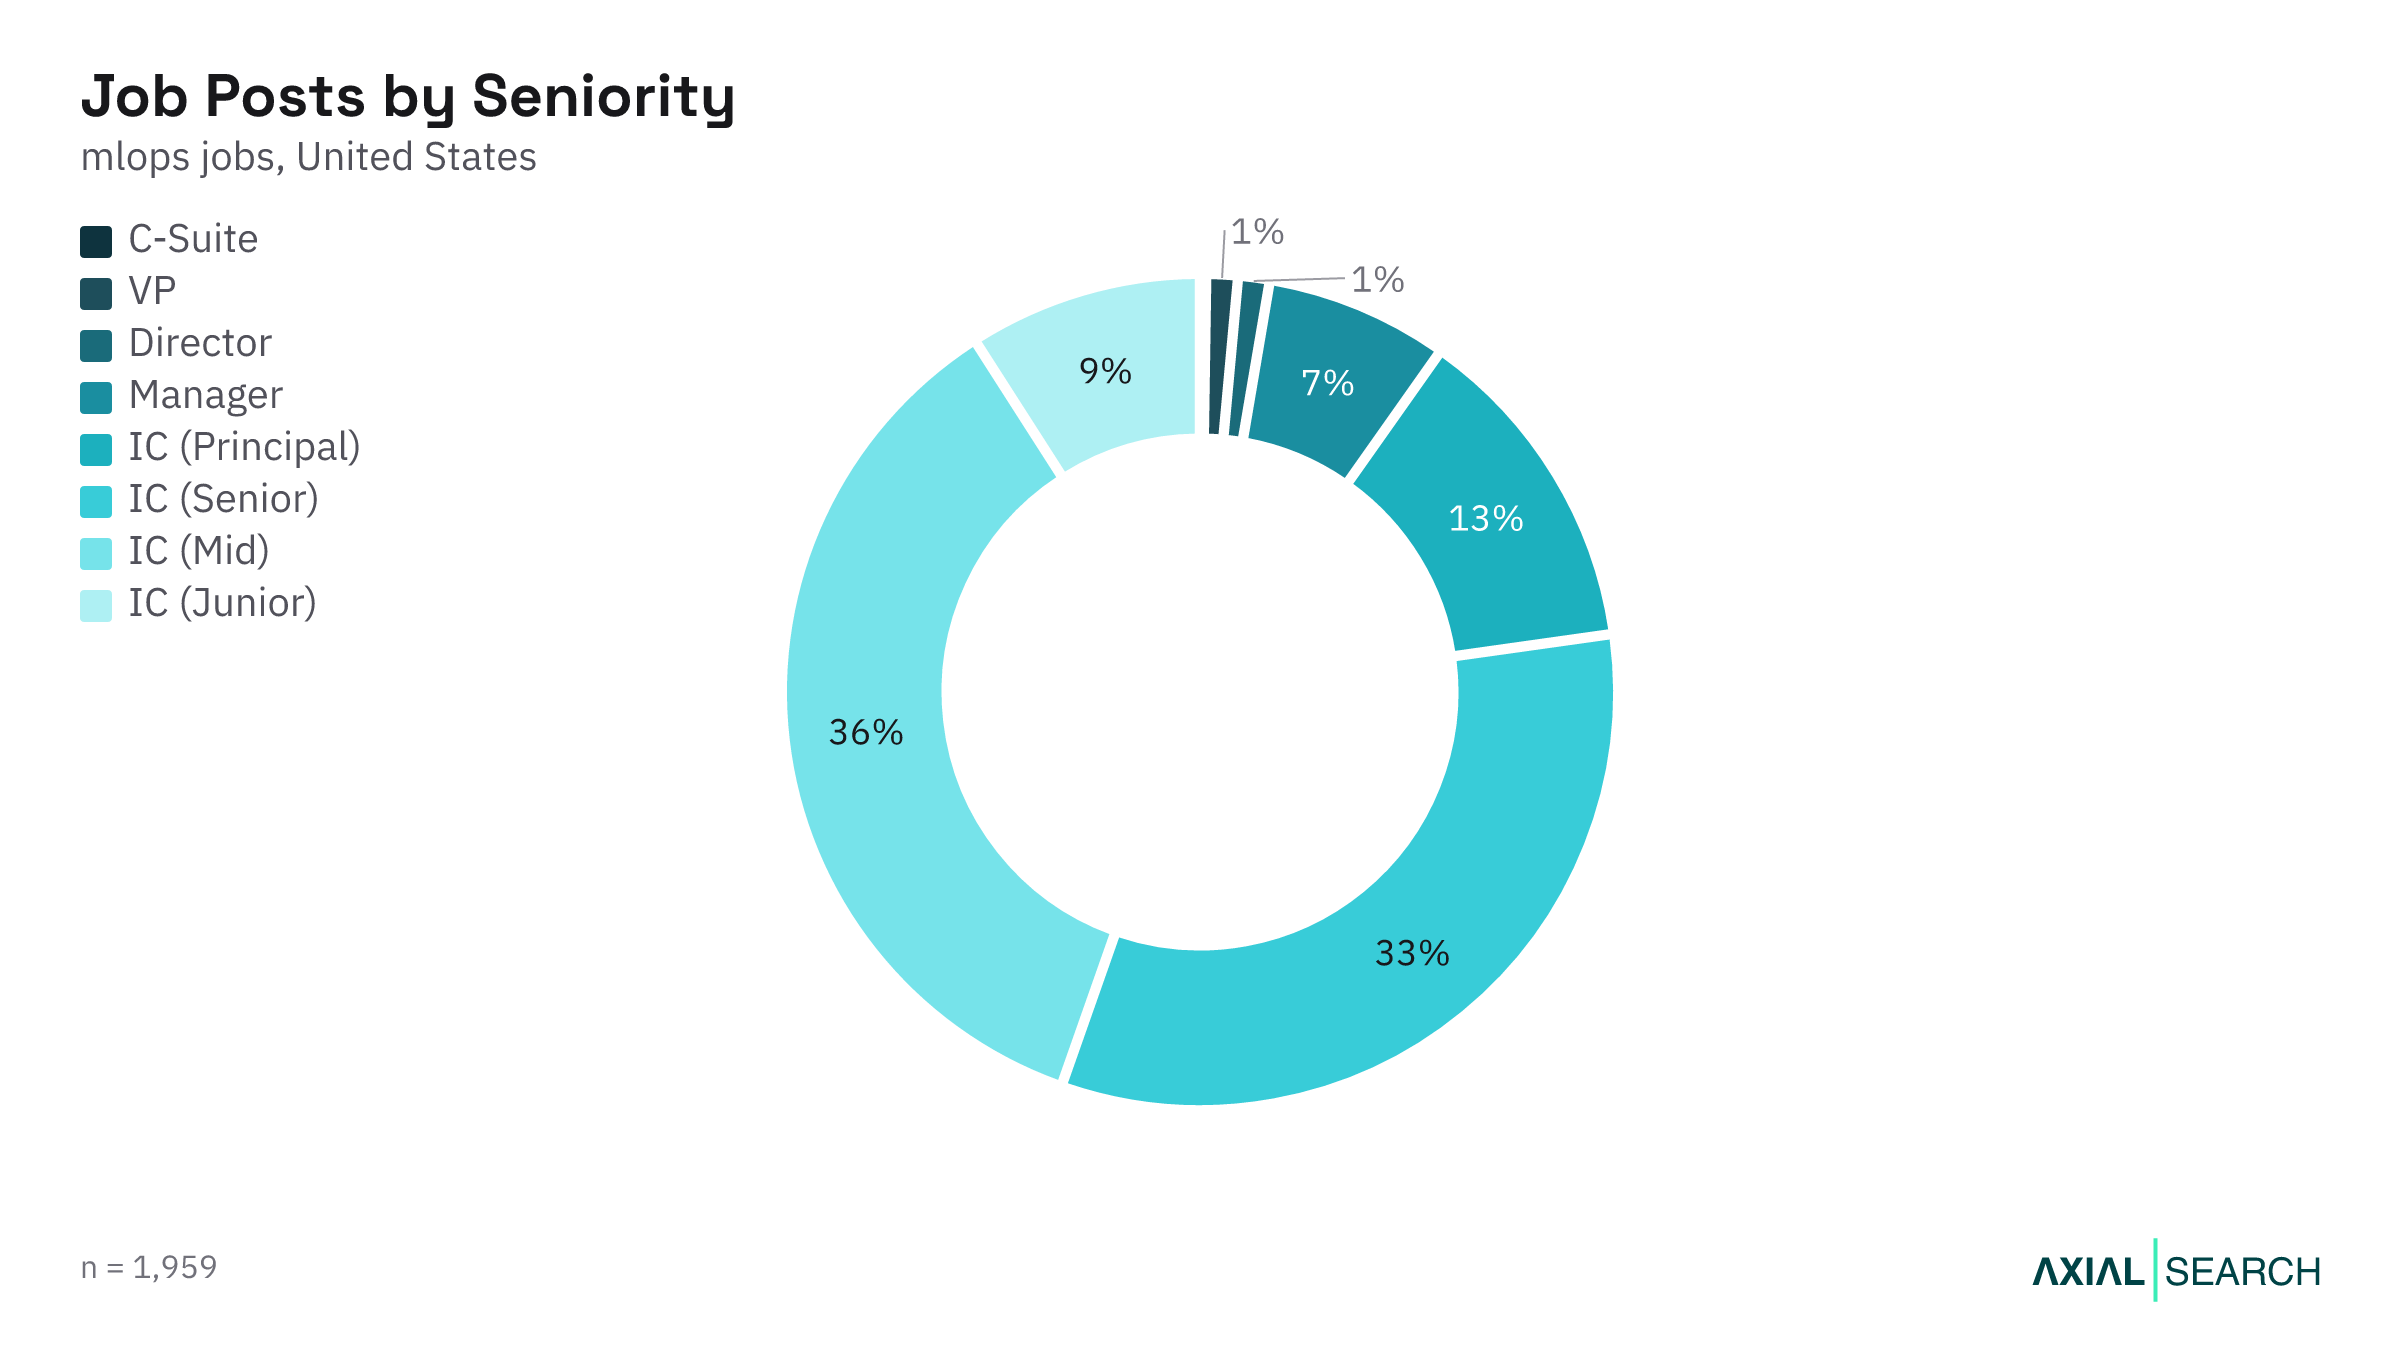
MLOps is an individual contributor market.
Mid-level ICs account for 36% of all postings, senior ICs another 33% and junior ICs 9%, so 78% of the market sits in those three bands. Principal ICs — the deep-specialist track — represent 13%. Manager roles make up 7%, Directors 1%, VPs 1% and C-suite postings are statistically zero.
If you're hiring for AI recruitment, this is the reality: you're competing for a narrow band of mid-to-senior ICs who have shipped models to production and know how to keep them running at scale. The market pays for hands-on builders, not strategic overseers, and the demand concentrates where candidates have 3 to 6 years of experience plus fluency with the cloud stack, MLOps tooling and production deployment patterns.
Full-time versus contract MLOps roles
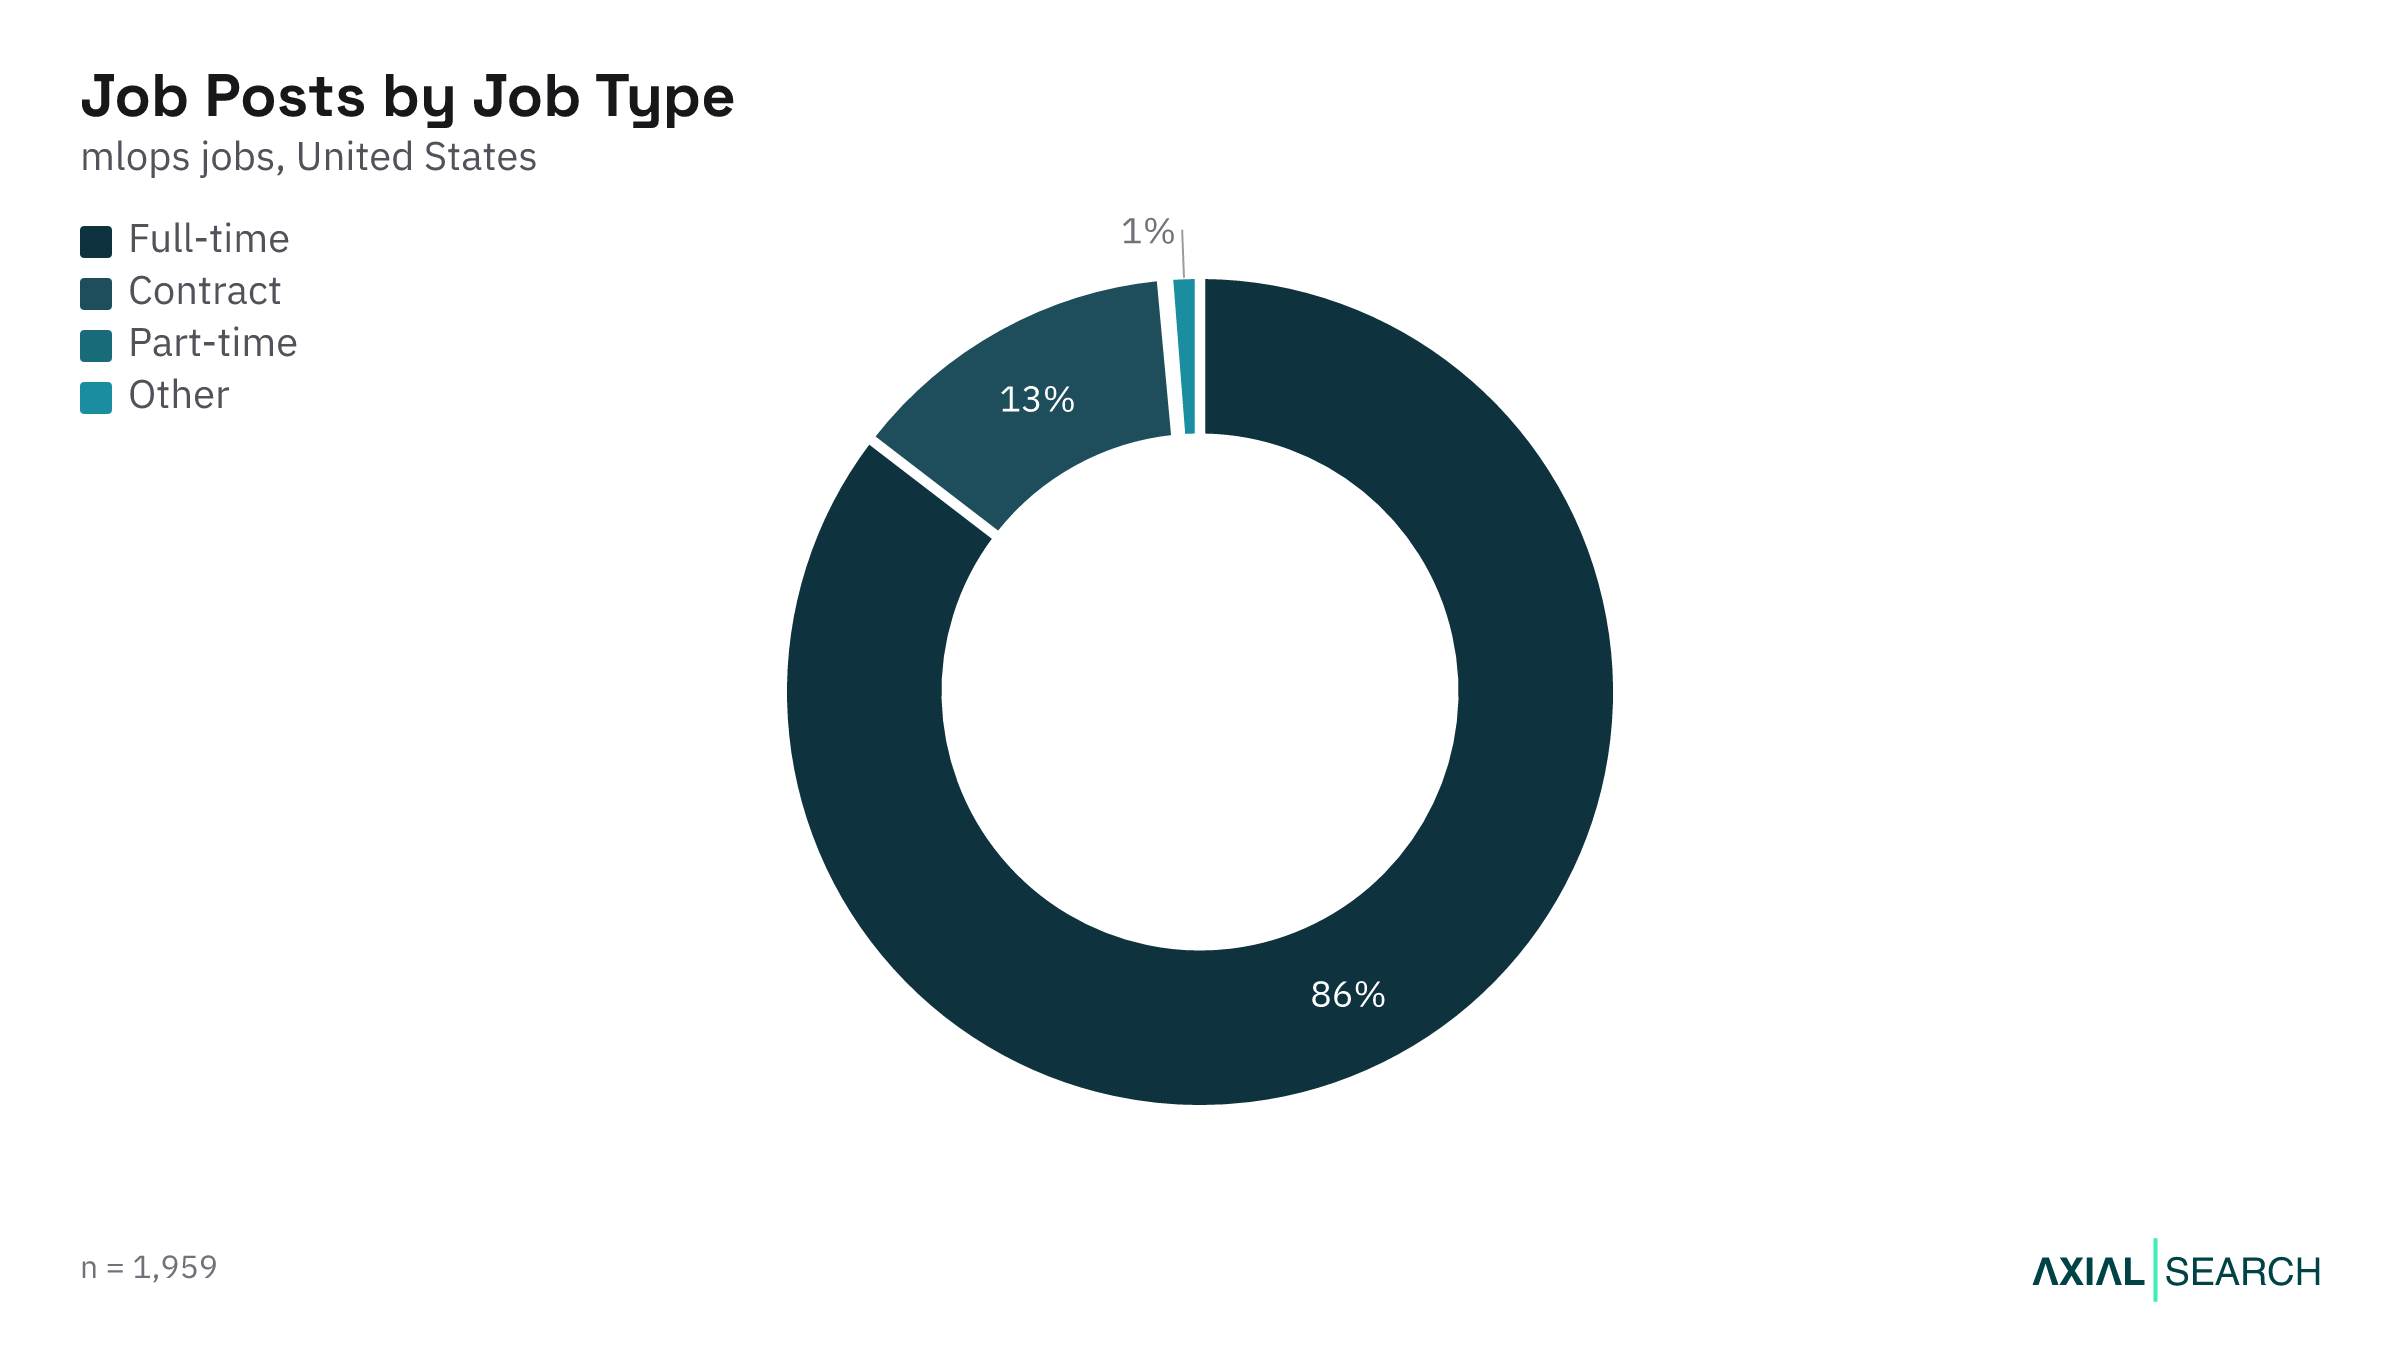
Most MLOps postings are full-time (86%), but 13% are contract roles — a higher contract share than most AI functions see.
Part-time roles account for less than 1%.
The contract volume reflects two patterns: project-based MLOps work at consulting firms, where a model pipeline gets built and handed off, and companies that need a deployment system stood up but aren't ready to staff it permanently. Plenty of direct employers post contract openings when they're testing a new capability or covering a temporary gap.
Remote, hybrid and onsite MLOps roles
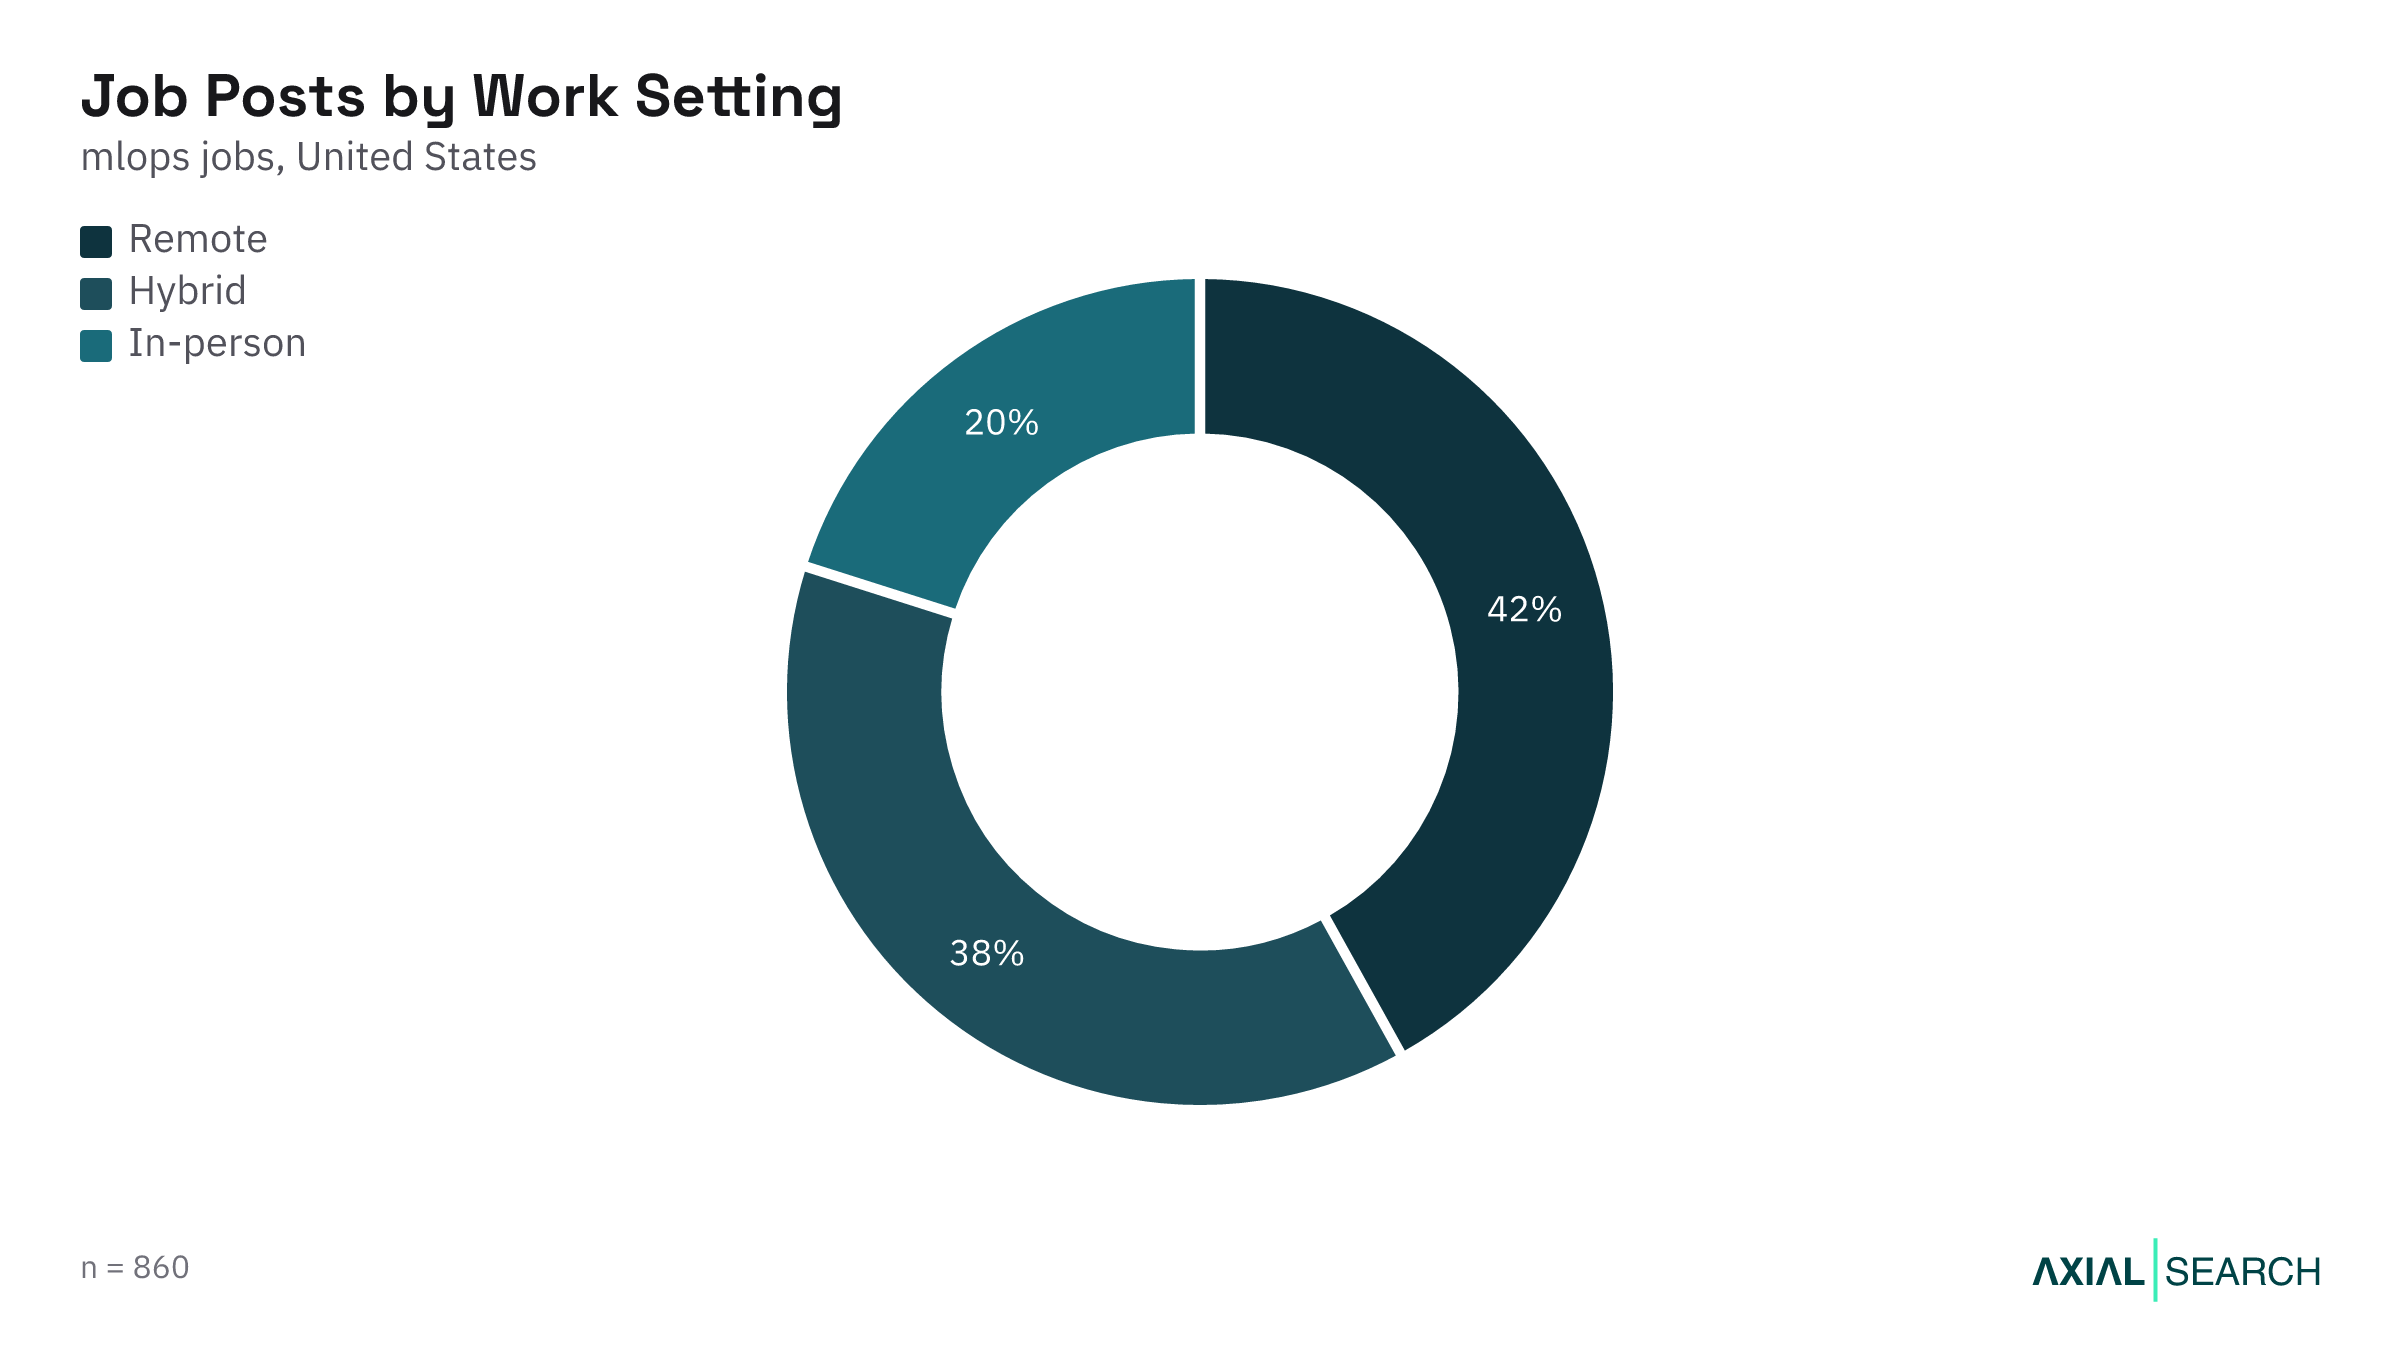
Most postings don't state a work model at all, but among the 44% that do, the split tilts remote.
Fully remote postings account for 42% of specified roles, hybrid makes up 38% and only 19% require full-time in-person presence. So while the work clusters in a few cities, a lot of it can be done from anywhere — which is helpful given how concentrated the geographic demand is. The remote share is higher in MLOps than in most AI functions, likely because the work is infrastructure-focused and doesn't require constant face-to-face collaboration the way product or strategy roles often do.
Where MLOps jobs are located
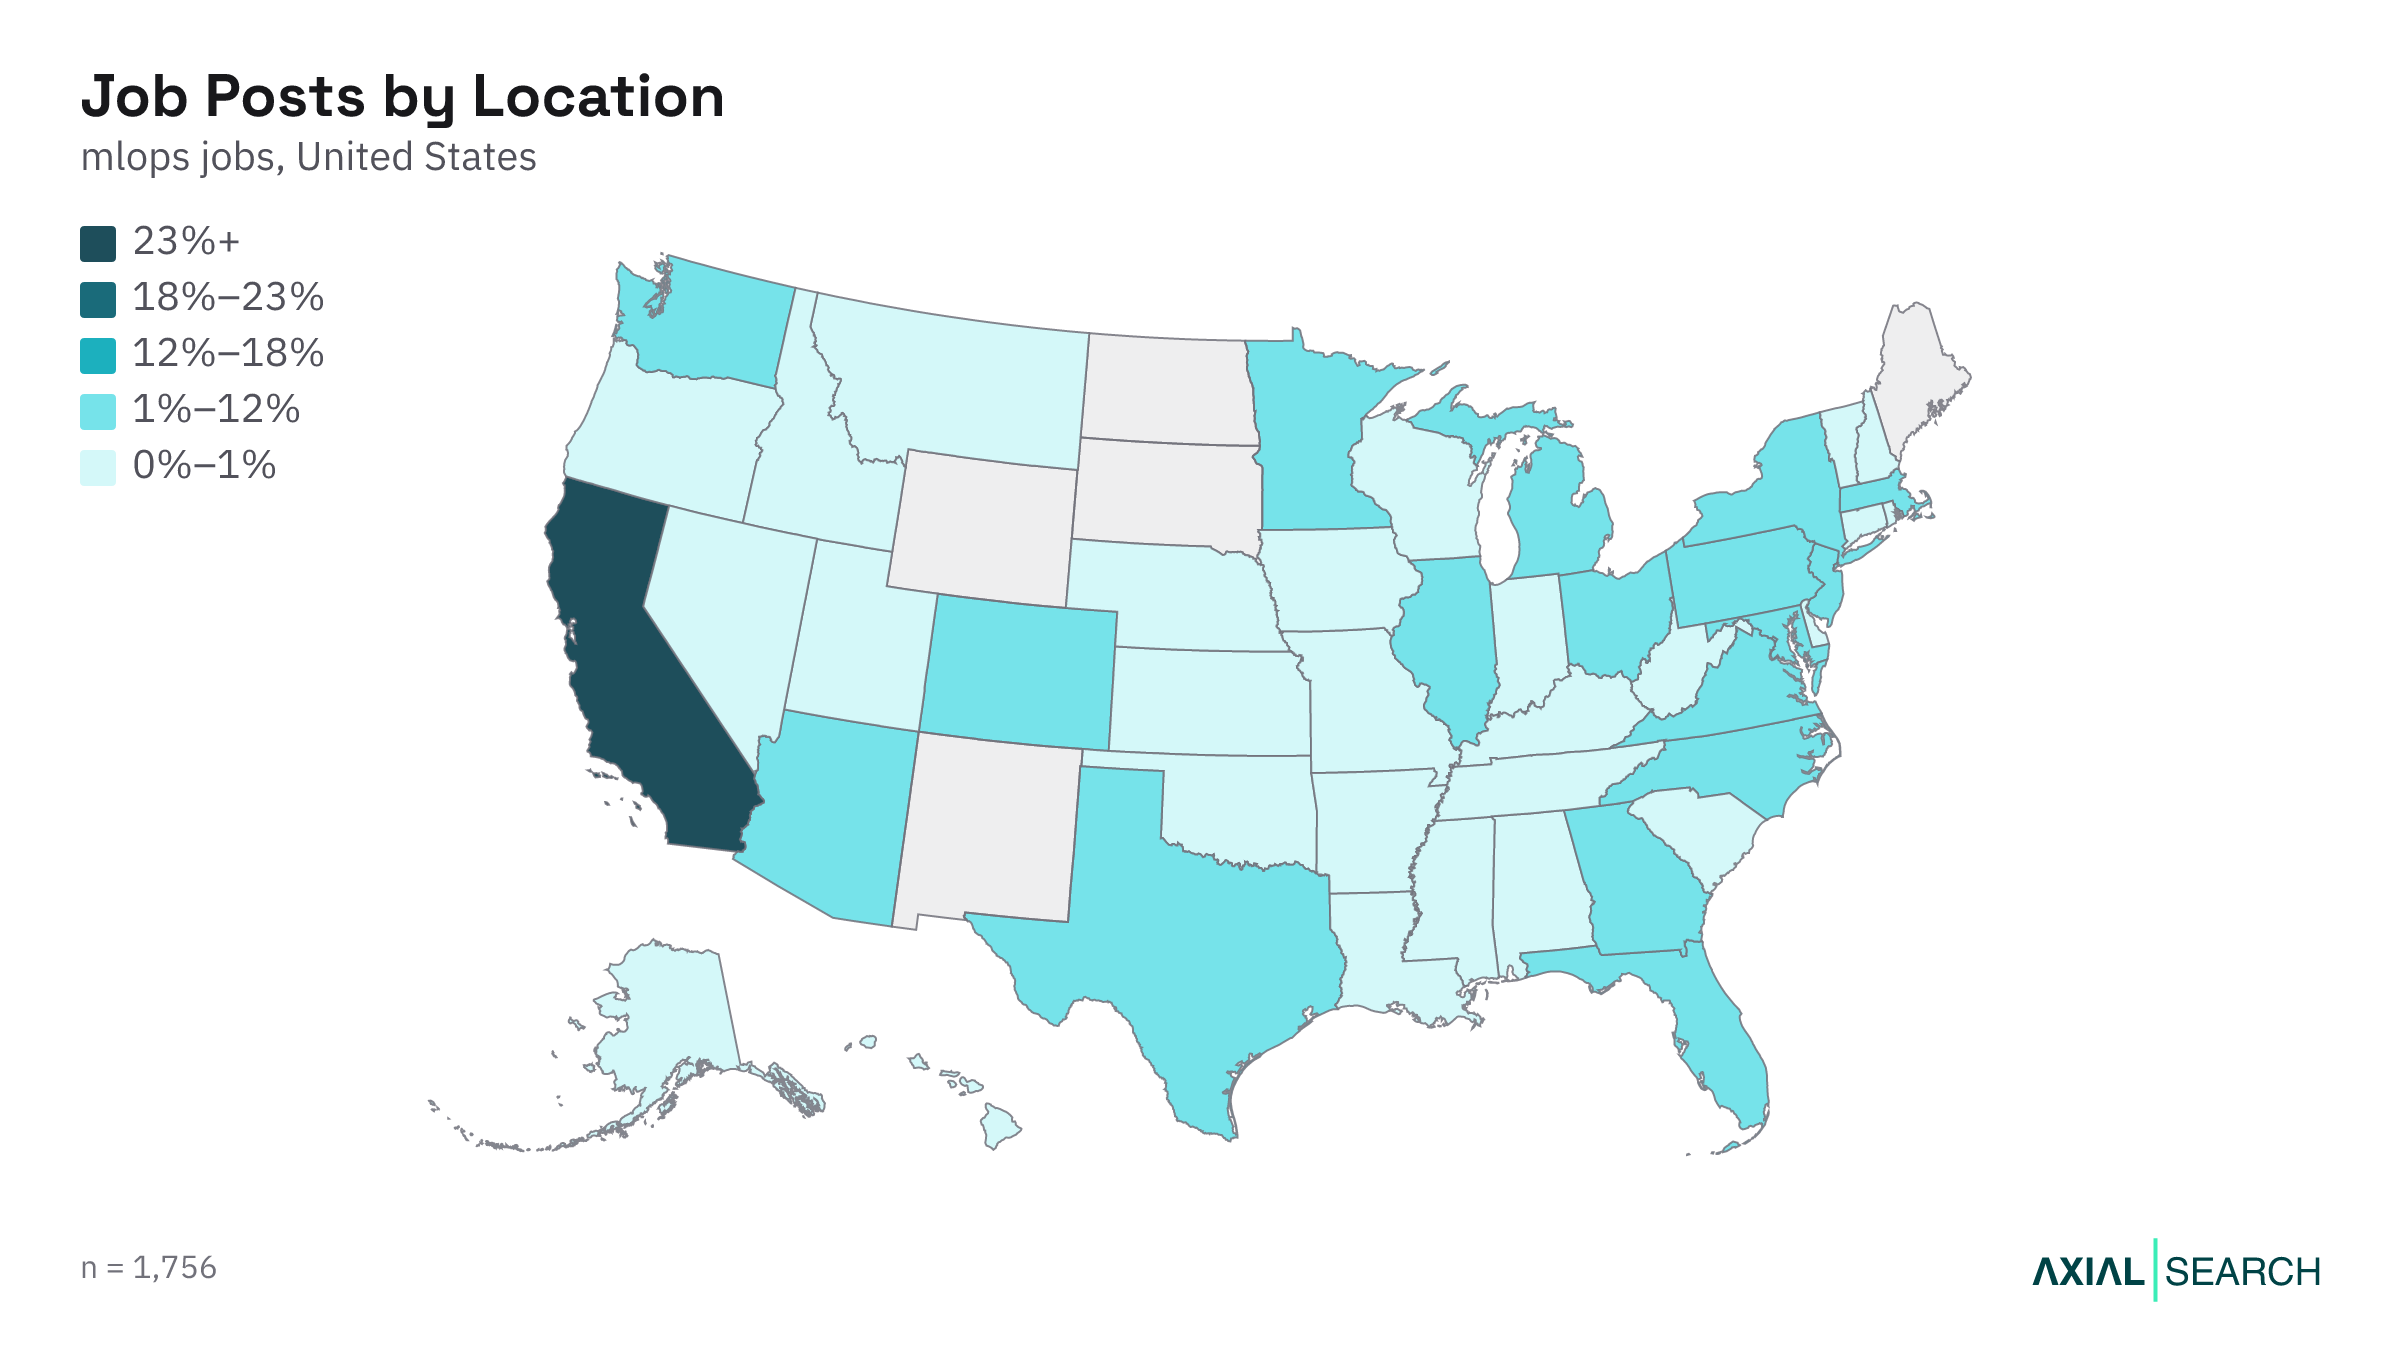
MLOps jobs cluster more sharply than almost any other AI function.
California alone accounts for 27% of all US postings — nearly triple the share of Texas and New York, which each sit at 9%. Washington follows at 6%, Massachusetts at 5%, Virginia at 4% and Pennsylvania at 4%. Illinois posts 3% of MLOps roles nationally.
California's dominance is partly a function of sheer volume in the Bay Area, but Texas, New York, Washington and Massachusetts all show up with meaningful counts. The work is more geographically concentrated than most AI hiring, yet a dozen states each post more than 50 roles, so candidates outside California still have options and employers outside the Bay Area can still build teams locally if they're willing to compete on comp and remote flexibility.
The top cities for MLOps roles
At the city level, San Francisco is the single biggest market by a wide margin, posting nearly one in ten of all US MLOps roles — 9.3% when remote-only postings are excluded.
Sunnyvale follows at 4.2%, Seattle at 4.1%, Austin at 3.5%, Boston at 3.3% and Chicago at 3.2%. Mountain View (2.7%) and Atlanta (2.6%) round out the top eight.
The Bay Area cities together account for roughly a sixth of the national market. Seattle, Austin and Boston each post a meaningful share, but the concentration in California is real.
For where these jobs pay the most, see MLOps salaries.
Final Thoughts
For candidates. MLOps is a builder's market. What gets you shortlisted is shipping models to production, keeping them running at scale and fluency with the cloud stack — AWS, Docker, Kubernetes and the MLOps tooling layer. Lead with what you built and what broke, not the years you've been doing it. The demand is steady, the pay is competitive and the work is remote-friendly, but the pool is thin, so your leverage is real if you can show production experience. If you prefer building scalable systems over managing deployments, ML engineering hiring demand shows where model architecture work is heading.
For employers. This is a narrow, competitive market: 1,959 US postings, 83% of them concentrated in mid-to-senior IC roles, and the capabilities that matter most — Hands-On Execution and Architectural Fluency — are the hardest to screen for on paper. Interview around production systems candidates have built, not certifications they hold, and be ready to move quickly.
Methodology & sources
- Data sources. Job data is collected from publicly available postings on online job boards and updated weekly, covering US roles posted since January 2026. Explore and filter it on our live AI job market dashboard.
- Salaries are derived from the minimum and maximum bands employers post, annualized, and reported as percentiles, not averages.
- Hiring volume counts matching postings per week; location, seniority, sector, company size, employment type and work model figures are each group's share of postings.
- Work-setting shares are computed over the 860 postings (44% of the total) that state a work model — the rest are silent, not counted as a category.
- The leadership profile reflects the relative emphasis across leadership capabilities inferred from job-description language; skills, tools and certifications are drawn from AI analysis plus programmatic scanning of posting text.
- Education and experience figures are based on the subset of postings that state those requirements: 1,231 postings mention a degree requirement (63%), 1,501 state years of experience (77%), and 906 specify degree fields.
- Skill, tool, certification and capability figures reflect what postings mention — an item not appearing means it wasn't stated in the posting, not that it isn't wanted.

The State of the MLOps Job Market in 2026
The complete picture of the mlops job market in 2026: hiring demand, what these roles pay, where the jobs are, who's hiring and what it takes to get in.

What MLOps Roles Pay in 2026
What mlops roles pay in 2026: median salary, pay by seniority, top-paying sectors and locations, and how often bonus and equity are mentioned in US job postings.

How to Land an MLOps Role in 2026: Skills That Get You Hired
How to become a mlops professional in 2026: the leadership capabilities employers screen for, the experience and degrees required, the certifications that matter, and the skills most in demand across US postings.
Turn AI ambition into lasting business value
Whether you're hiring your first AI leader or scaling enterprise transformation capability, we help you define, assess and recruit the people who make it stick.