
How Much Do MLOps Engineers Make? 2026 Benchmarks
What MLOps roles pay in 2026: median salary, pay by seniority, top-paying sectors and locations, and how often bonus and equity are mentioned in US job postings.
 Updated: July 23, 2026
- The MLOps market pays for depth: The median sits at $185,000 and the Principal IC track reaches the function's ceiling, paying more than Director or VP roles.
- Manufacturing leads on MLOps compensation: At $253,000 median salary, it pays well ahead of Technology, where the majority of hiring happens.
- Equity mention rates are close across company sizes: Among MLOps postings that disclose pay, enterprise and mid-market firms both reference equity in 29%, ahead of startups at 25%.
- Washington beats California on pay: Washington posts a $258,000 median salary versus California's $250,000, though California captures 27% of all postings.
- Bay Area metros dominate the top slots: Santa Clara, Cupertino and Palo Alto all clear $269,000, with Seattle close behind at $258,000.
- Bonus appears twice as often as equity: 24% of MLOps postings mention a bonus versus 13% for equity, and equity concentrates at Principal IC and Manager tiers.
How much do MLOps engineers make?
The median MLOps salary is $185,000, and the distribution runs tight — half of all postings land between mid-level and senior IC, which compresses the middle of the range. The Principal IC tier is the standout: it outpaces Director money at the median, so staying technical doesn't cap your ceiling — it's the ceiling.
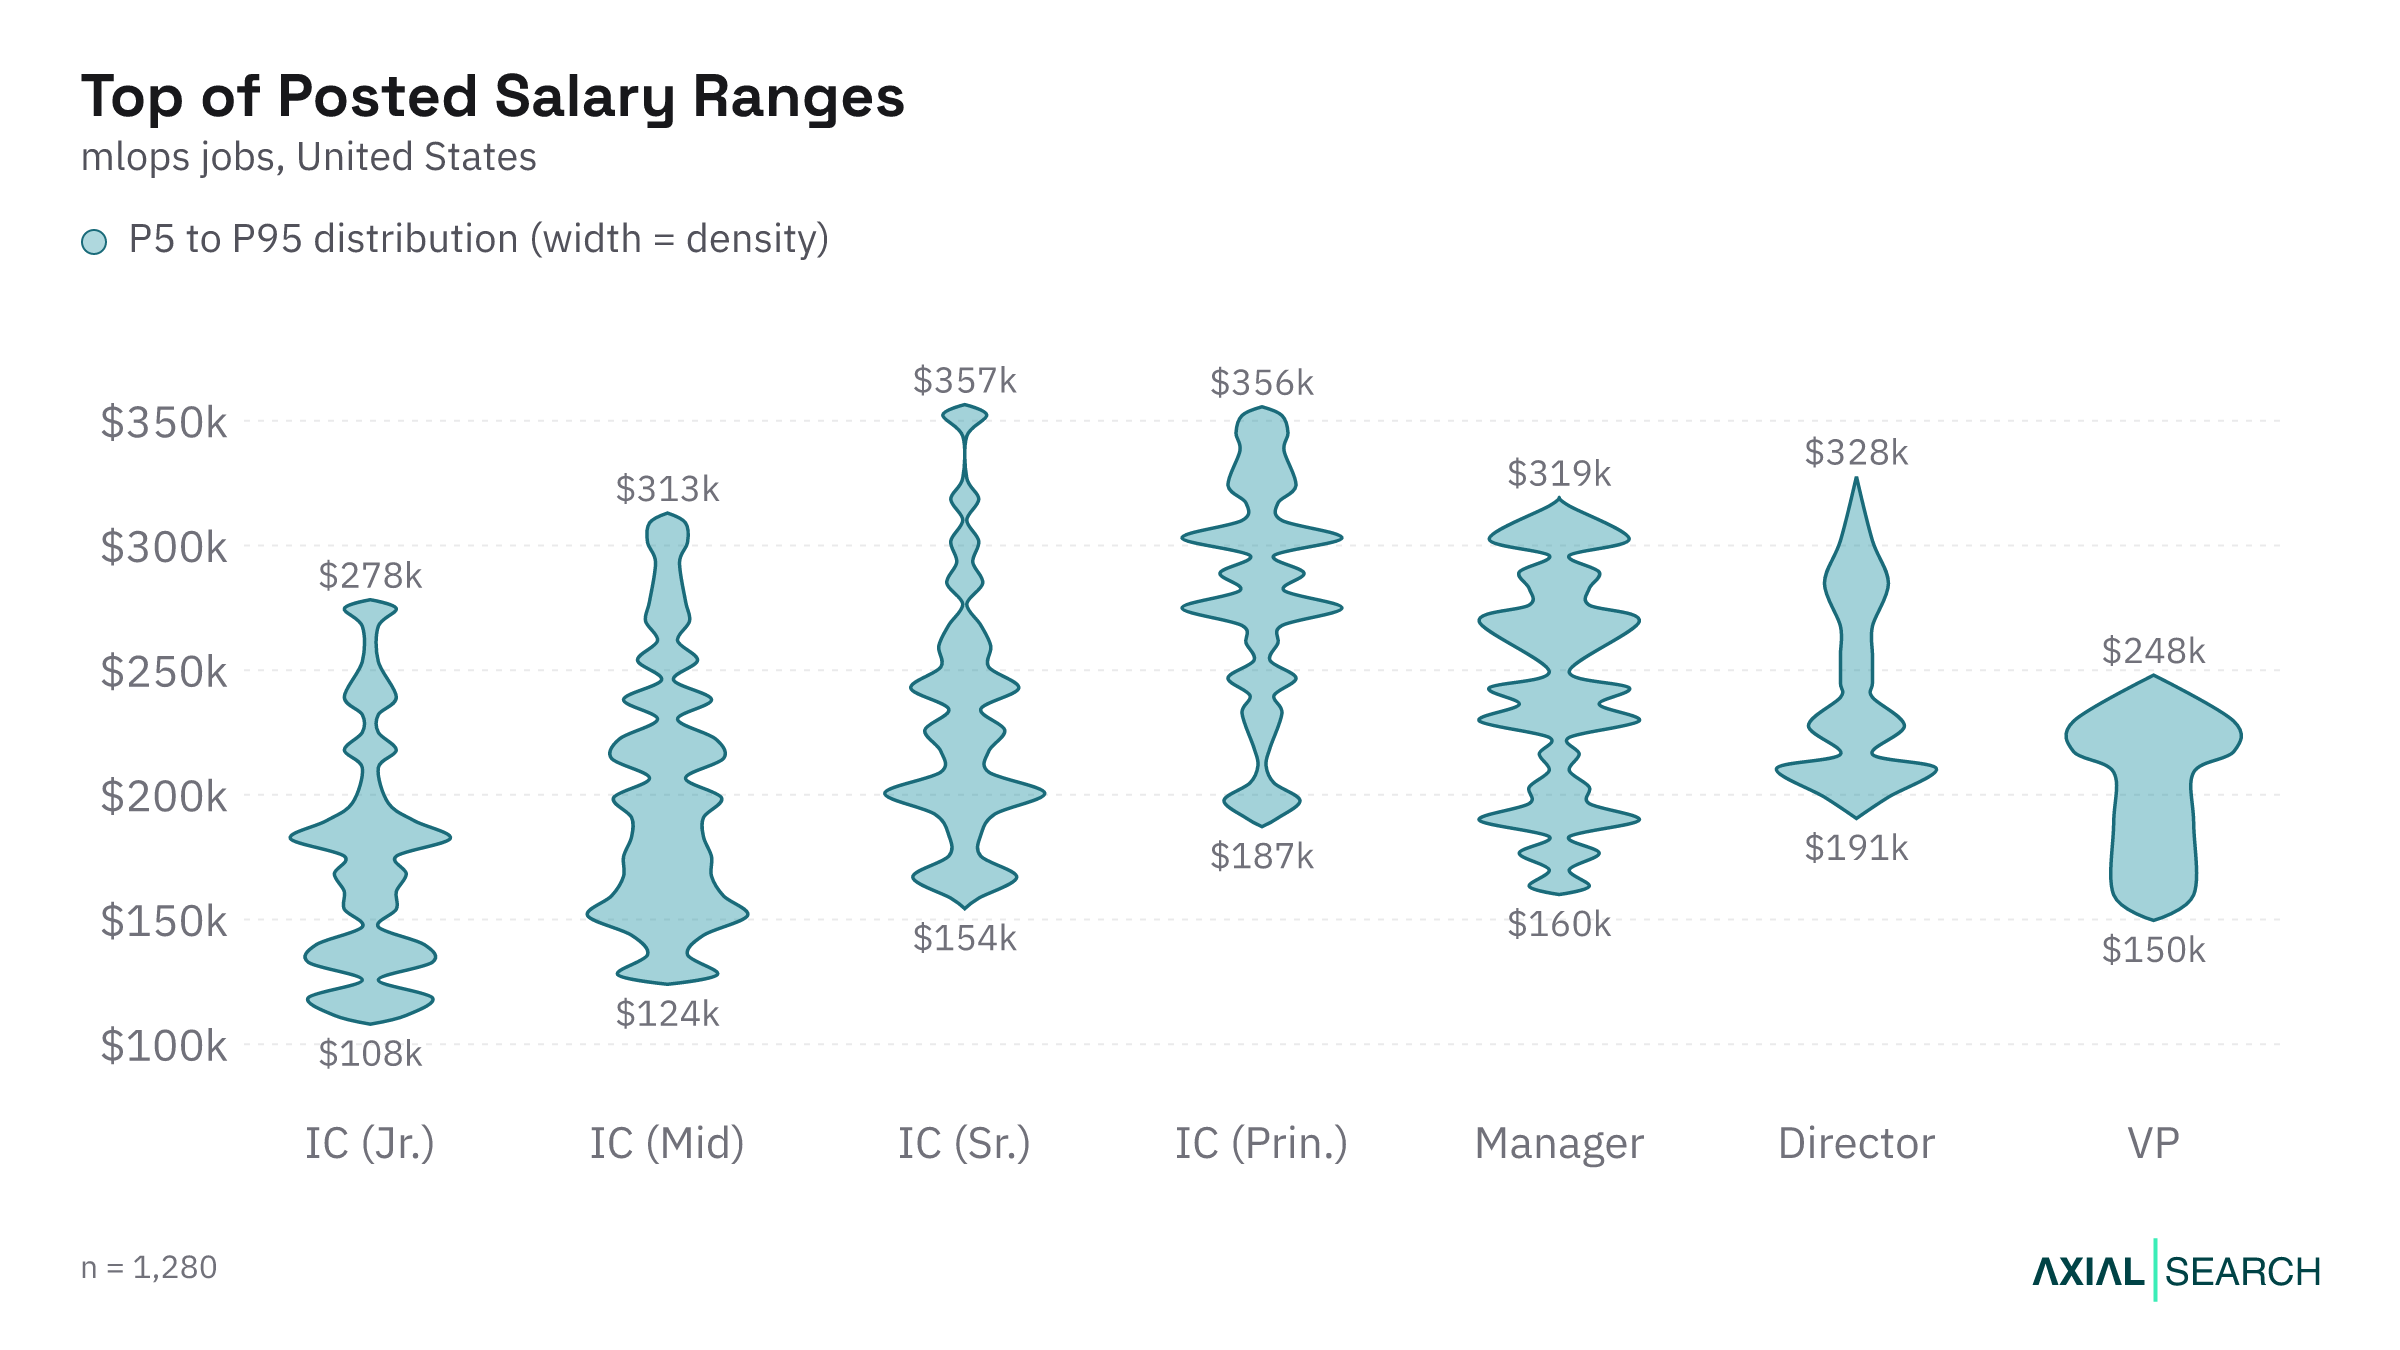
Top of the posted range by seniority — the median and typical maximum of what's posted, 5th to 95th percentile. This is the ceiling candidates can credibly negotiate toward, not the typical offer.
| Seniority | 5th percentile | 25th percentile | Median | 75th percentile | 95th percentile |
|---|---|---|---|---|---|
| IC (Junior) | $112,000 | $130,000 | $168,000 | $206,000 | $291,000 |
| IC (Mid) | $125,000 | $156,000 | $195,000 | $230,000 | $313,000 |
| IC (Senior) | $153,000 | $189,000 | $220,000 | $252,000 | $356,000 |
| IC (Principal) | $185,000 | $250,000 | $285,000 | $313,000 | $358,000 |
| Manager | $161,000 | $197,000 | $241,000 | $281,000 | $317,000 |
| Director | $191,000 | $210,000 | $225,000 | $275,000 | $327,000 |
| VP | $150,000 | $189,000 | $218,000 | $230,000 | $248,000 |
Where two percentiles show the same figure, employers are clustering on a round number at that end of the band.
The median across all levels is higher at Principal IC than at any other tier in the table above — well past Director and Manager, and far above VP. That inversion is unusual and it matters: MLOps rewards the people closest to production infrastructure. That pattern has held steady over the past year, consistent with steady MLOps hiring rather than a sudden surge.
Where most MLOps salaries cluster
The market is densest at mid and senior IC levels — together they account for more than two-thirds of postings — so the middle of this distribution is where most candidates land.
Because so much of the market sits at mid-to-senior IC or Manager level, the middle of this market skews technical. If you're hiring, the competition is for the hands-on builders, not the planners. Director is effectively the ceiling on title in this dataset — the sample thins out too fast past it for a stable read, and it's a market thin enough that AI recruitment built for MLOps hiring is often the difference between filling the req and leaving it open.
How MLOps pay compares to nearby AI engineering roles
MLOps pays modestly more at the median than the broader AI engineering function, reflecting the premium on production-infrastructure depth over model-building breadth.
The two functions overlap heavily in the skills they screen for, so the gap comes down to scope: MLOps owns the deployment and monitoring layer end to end, while AI engineering spans model integration too. See AI engineering salaries for the full comparison.
What is the full salary range for MLOps engineers?
The full posted MLOps salary range runs from $112,000 at the 5th percentile for Junior ICs up to $358,000 at the 95th percentile for Principal ICs — see the table above for the full breakdown by seniority.
How much room is there to negotiate at the top of the MLOps range?
The gap between the 75th and 95th percentile varies more than a clean seniority trend — it's widest for Senior ICs and narrowest for VP roles, per the table above.
That means negotiating leverage doesn't scale predictably with title — a Senior IC candidate with leverage can credibly chase Principal-level money, while VP offers cluster tightly around the posted figure.
Which industries pay MLOps engineers the most?
MLOps pays the most where production ML systems are mission-critical and failure carries real cost — Manufacturing leads at a median salary around $253,000, with Technology close behind at $236,000.
| Sector | Median salary | Postings |
|---|---|---|
| Manufacturing | $258,000 | 158 |
| Technology | $236,000 | 467 |
| Life Sciences | $212,000 | 42 |
| Professional Services | $202,000 | 114 |
| Financial Services | $199,000 | 108 |
Manufacturing's lead is sharper than most functions see — likely because factory-floor ML runs at scale, with tight uptime requirements and real-time feedback loops. Technology firms pay well but they also hire the most volume, which compresses the median slightly.
How much does sector really matter for MLOps pay?
Less than you'd think — roughly $51,000 separates the top sector (Manufacturing) from the bottom of this list (Professional Services).
Sector matters, but seniority moves your pay far more: the difference between a Junior IC and a Principal IC is substantial.
Which sectors post the most MLOps roles?
Technology posts by far the most MLOps roles — 434 in this dataset, roughly triple the next sector — even though it doesn't pay the most.
That's the reality for candidates optimizing for volume over ceiling: the sector with the most openings (Technology) isn't the one with the highest pay (Manufacturing).
Does company size affect MLOps pay?
Yes, but not the way you'd expect: enterprise-scale firms (5,000+ employees) pay the most at $223,500 median salary, with startups and small companies not far behind at $209,000.
- Enterprise-scale (5,000+): $223,500 median salary, equity mentioned 29%.
- Startup-Small (<500): $209,000 median salary, equity mentioned 25%.
- Mid-market (500–5,000): $200,000 median salary, equity mentioned 29%.
Mid-market firms sit at the bottom on pay despite matching enterprise firms on equity mention rate. Startups and small companies aren't far off the enterprise ceiling, which tells you MLOps pay compresses across company size more than it does in most AI functions.
Does company size affect MLOps equity offers?
Barely, and not the way the startup stereotype suggests — among the MLOps postings that disclose pay, enterprise and mid-market firms both mention equity in 29%, ahead of startups at 25%.
That's a narrower and differently-shaped gap than in most senior functions, where startups typically lead on equity. For MLOps, equity mention runs close across company size, so the base salary gap is the bigger differentiator.
Where do MLOps engineers earn the most?
Pay is geographically concentrated: Washington edges out California at $258,000 median salary to California's $250,000, even though California accounts for 27.2% of all postings.
| State | Median salary | Share of postings |
|---|---|---|
| Washington | $258,000 | 5.4% |
| California | $251,000 | 26.7% |
| New York | $220,000 | 8.8% |
| Massachusetts | $200,000 | 5.0% |
| Virginia | $198,000 | 4.2% |
The rest of the top five — New York, Massachusetts and Virginia — cluster around $200,000. The broader pattern holds: the coasts pay the most, Washington and California dominate on volume and compensation, and the gap between the top-paying states is narrow. Where you work moves your salary far less than how senior you are.
Does MLOps pay track posting volume by state?
Not closely — Washington posts the highest median salary ($258,000) but only 5.5% of postings, while California posts the most volume (27.2%) at a slightly lower $250,000.
That's worth knowing if you're choosing where to build a team: the state with the deepest candidate pool isn't the one paying the most per role.
The top-paying cities for MLOps
Santa Clara leads the metro-level rankings at $287,500 median salary, with Cupertino and Palo Alto both above $269,000 and Seattle close behind at $258,000.
Those are Bay Area and Pacific Northwest metros where the biggest infrastructure-scale ML teams sit, and that concentration isn't likely to change soon.
How often are MLOps bonus and equity offered?
A bonus is mentioned in 24% of MLOps postings and equity in just 13% — both are floors, not ceilings, since dollar figures are almost never posted. Many roles that don't advertise either still offer one; absence in the data means the posting was silent, not that nothing is on the table.
How often a bonus is offered
A bonus is mentioned in 24% of MLOps postings — less common than in AI strategy or architecture functions, which tracks with MLOps being closer to core engineering. If you're negotiating, ask for it even if it's not in the posting.
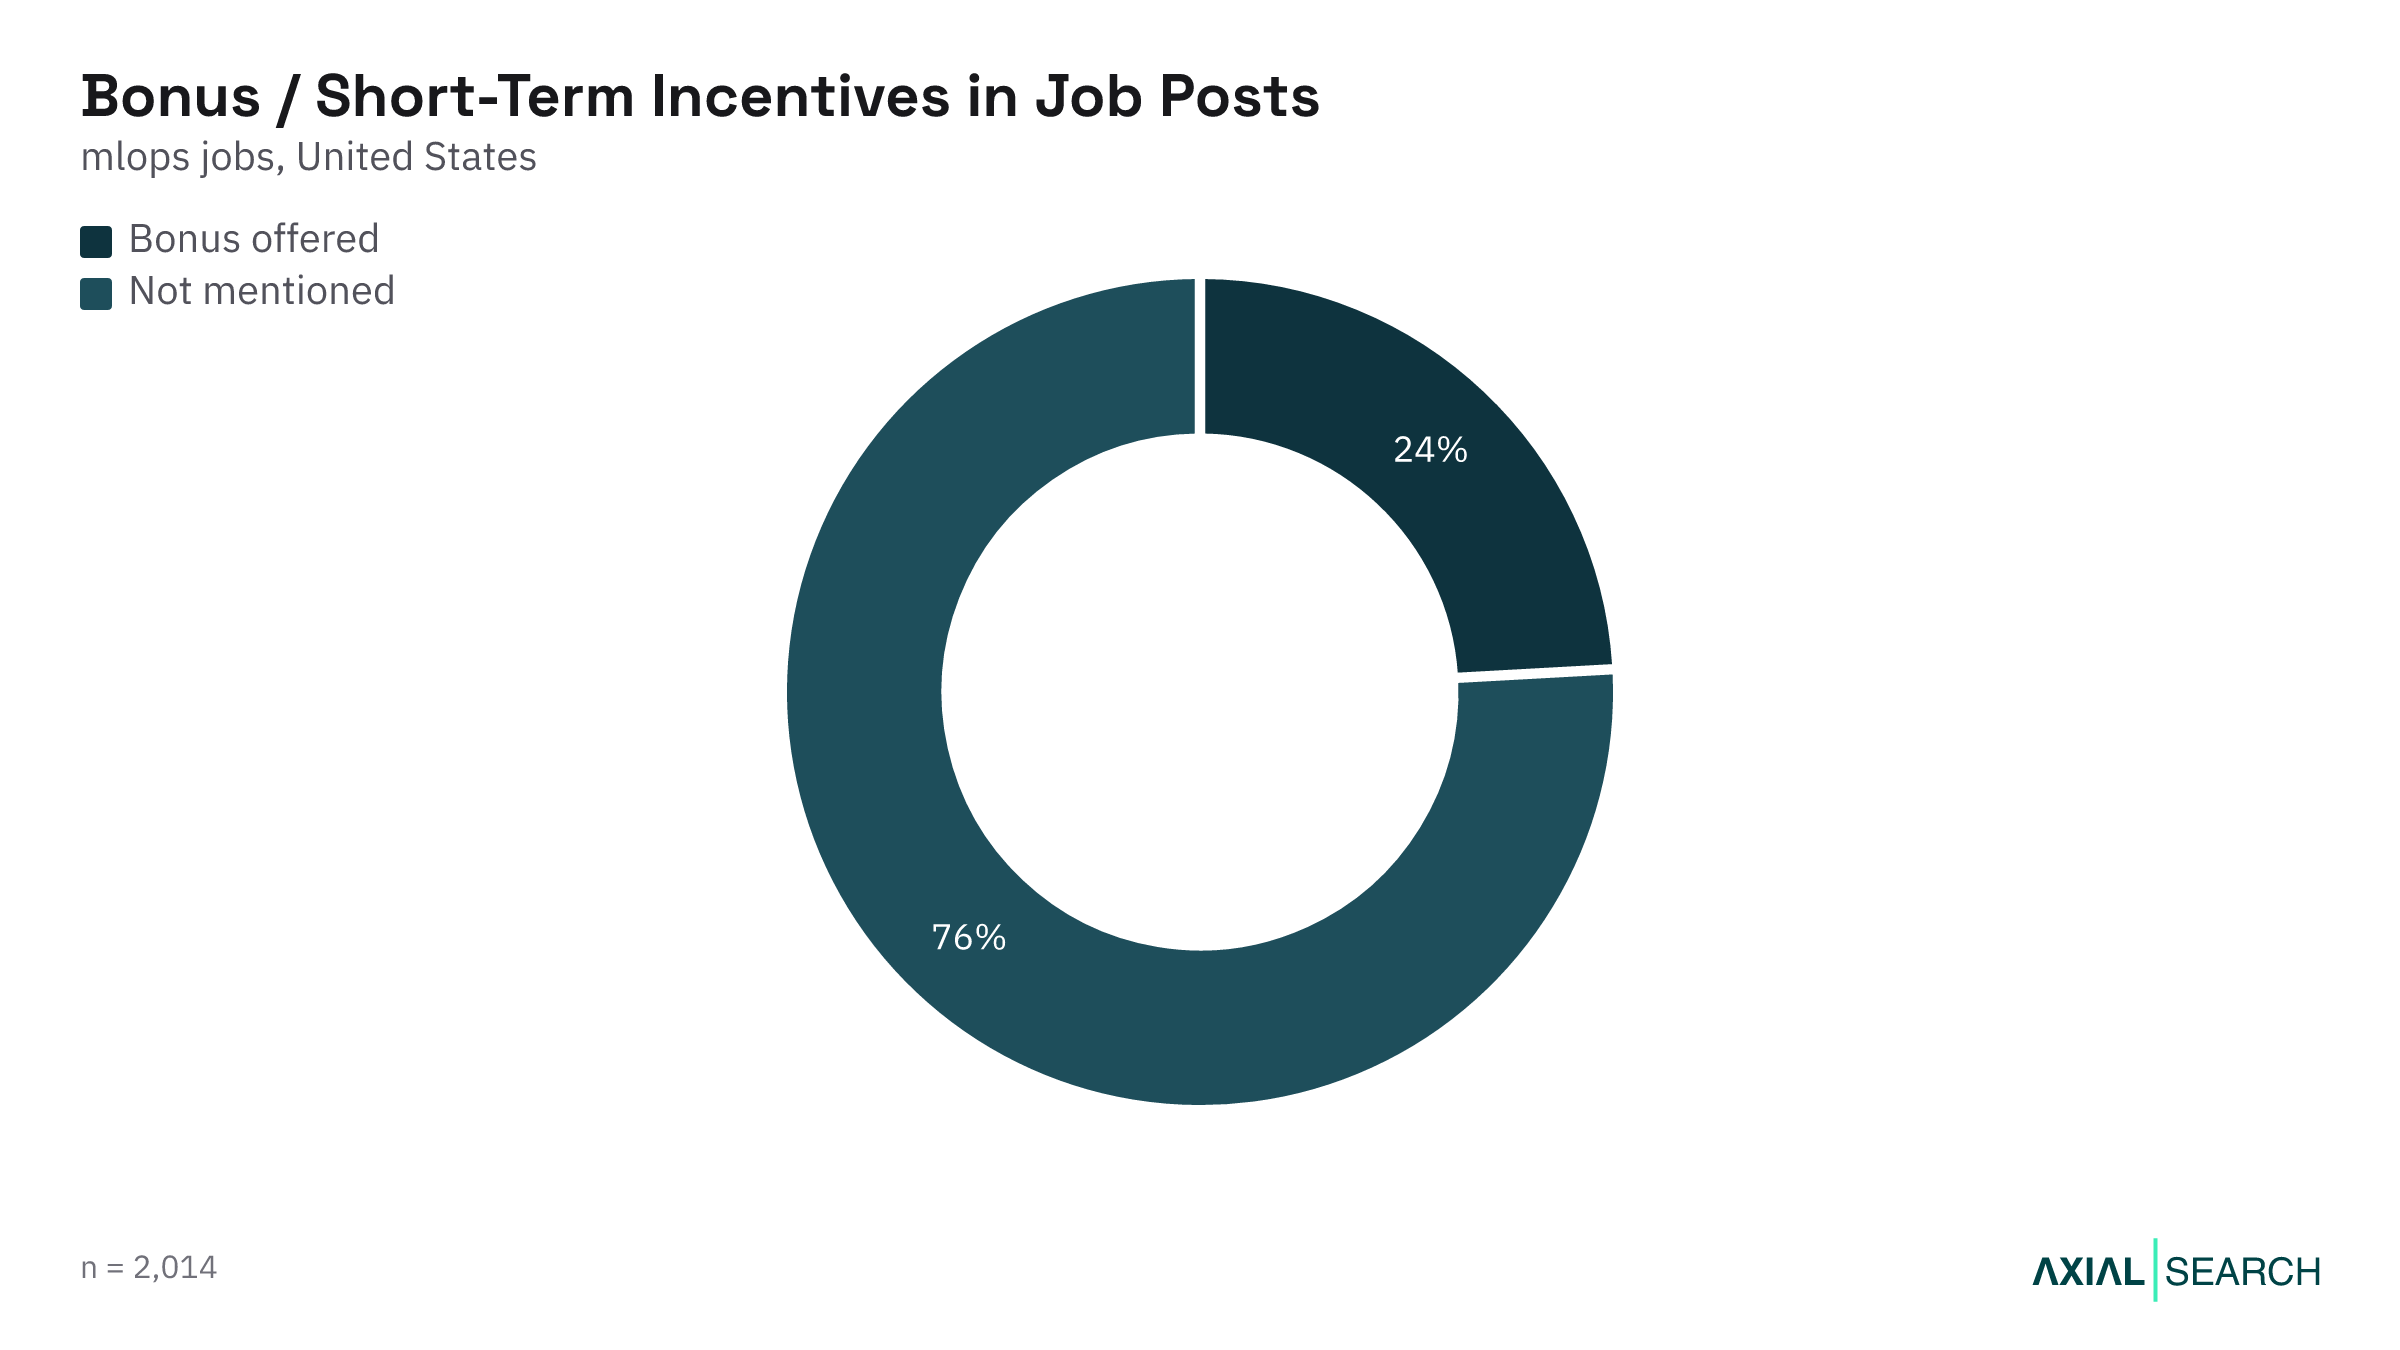
The rate varies sharply by level, from 37% at Junior IC down to 15% at Mid IC, then back up through Senior (30%) and Principal (28%) before peaking at 55% for VP.
How often equity is offered
Equity is mentioned in just 13% of postings, peaking at Principal IC and Manager level (21%) and dropping to 10–13% at mid-level roles. VP-level postings mention equity more often (27%), though the sample there is small.
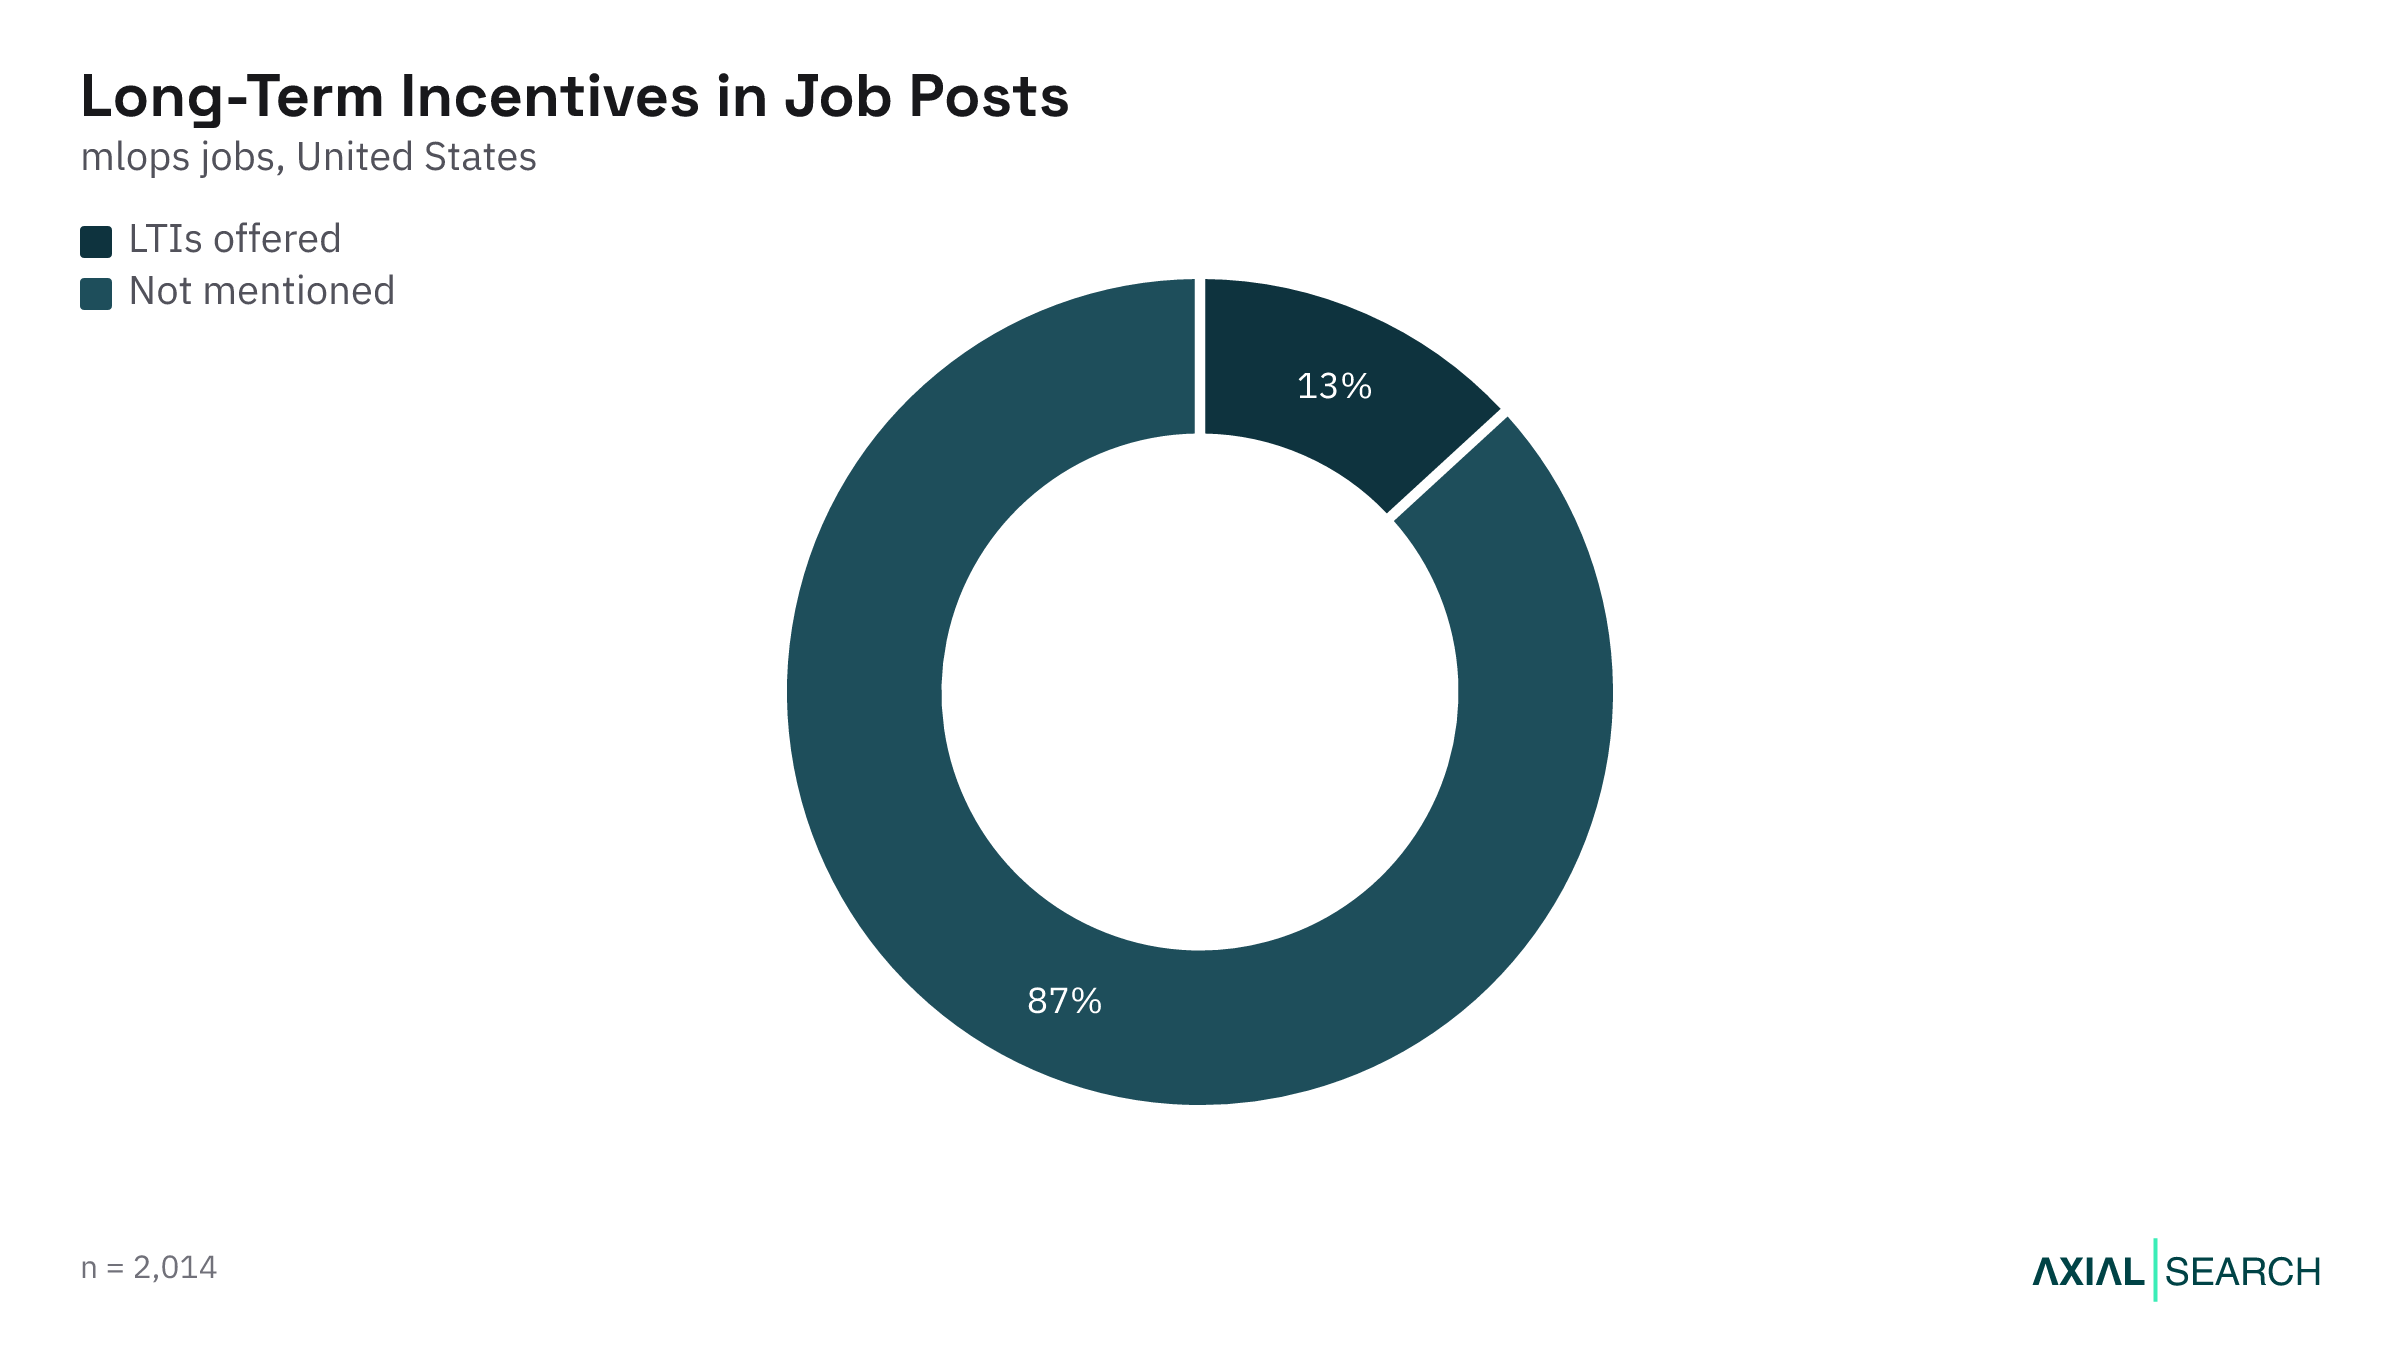
The broader signal is that equity in MLOps is used as a retention lever at the senior-IC and first-manager tier, not sprayed across all levels.
| Level | Bonus mentioned | Equity mentioned |
|---|---|---|
| IC (Junior) | 34% | 7% |
| IC (Mid) | 14% | 11% |
| IC (Senior) | 31% | 15% |
| IC (Principal) | 29% | 22% |
| Manager | 16% | 22% |
| Director | 30% | 10% |
| VP | 55% | 27% |
| C-Suite | 0% | 0% |
Final Thoughts
For candidates. The Principal IC track is the surprise: it outpaces both Director and VP at the median, so staying technical doesn't cap your ceiling. If you're mid-career and debating management, know that MLOps values depth more than span — and the market pays accordingly. Washington and California dominate on volume and compensation, but if you're remote-eligible the gap narrows. Equity shows up most often at Principal IC and Manager tiers, which means it's a retention tool for the roles hardest to backfill. Ask for it even when the posting is silent. If you lean toward model development over deployment infrastructure, ML engineering salaries reflect that architectural focus.
For employers. You're competing for a scarce skill set — two-thirds of the market sits at mid-to-senior IC, and the practitioners who can build and run the pipeline in production are the ones every firm wants. If your comp bands still assume management pays more than IC work, recalibrate: Principal ICs command the highest medians in this function. Mention equity in the posting, especially for senior IC and Manager roles; the data shows it moves the needle at those tiers. And if you're hiring at scale in Manufacturing or Technology, the market already knows you pay well — speed matters more than stealth.
Methodology & sources
- Data sources. Job data is collected from publicly available postings on online job boards and updated weekly, covering US roles posted since January 2026. Explore and filter it on our live AI job market dashboard.
- All salary figures are derived from the minimum and maximum salary bands employers post, annualized and reported as percentiles, not averages.
- Every salary figure on this page is the top of the posted range — the ceiling employers advertise, not the typical offer. The seniority table reports it at the 5th, 25th, 50th (median), 75th and 95th percentiles. Median salary in the sector, company-size and location tables is the median of that ceiling within each group.
- Bonus and equity figures are mention rates — the share of postings that state a bonus or equity. A posting silent on either is counted as "not mentioned"; it does not mean none is offered.

How Hot Is the MLOps Job Market in 2026?
The complete picture of the MLOps job market in 2026: hiring demand, what these roles pay, where the jobs are, who's hiring and what it takes to get in.

Who's Hiring MLOps Engineers in 2026
Where MLOps jobs are in 2026: hiring demand and trend, top states and cities, who's hiring by sector and company size, and the mix of seniority, contract type and remote work across US postings.

What It Takes to Land an MLOps Role in 2026
How to become an MLOps professional in 2026: the leadership capabilities employers screen for, the experience and degrees required, the certifications that matter, and the skills most in demand across US postings.
Turn AI ambition into lasting business value
Whether you're hiring your first AI leader or scaling enterprise transformation capability, we help you define, assess and recruit the people who make it stick.